Introduction to this course
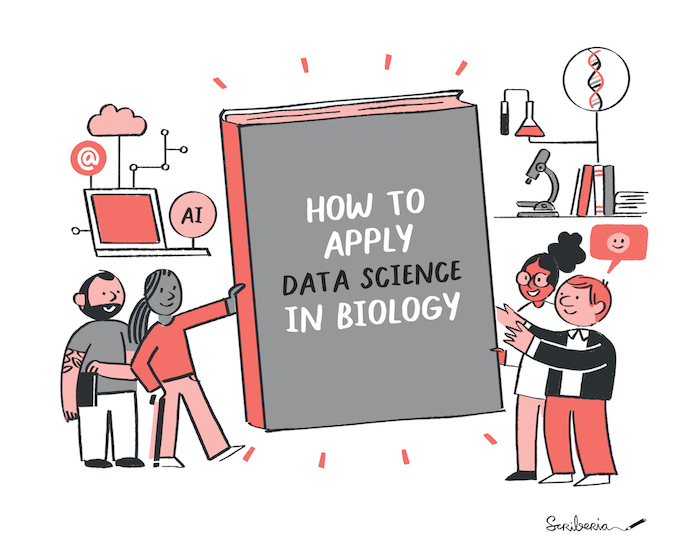
Figure 1. Two people with computational expertise holding a giant book towards two other people who conduct lab experiments. The book saya: how to apply data science in biology.
Better and faster research !
Figure 1. Researchers represented in a map indicating their journey to understand and apply computational approaches. Some may have just started their journey, some may have come far in the learning and some may have gained proficiency based on their research requirements.
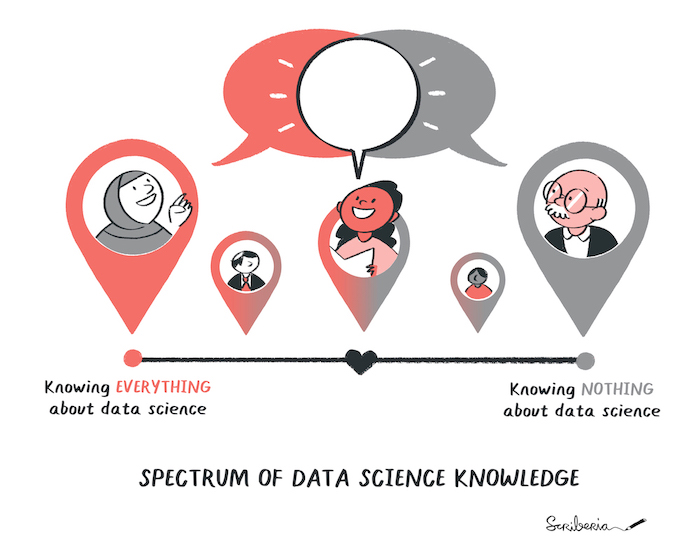
Figure 2. Researchers pour water on a tree, the water represents data science, the tree is the research.
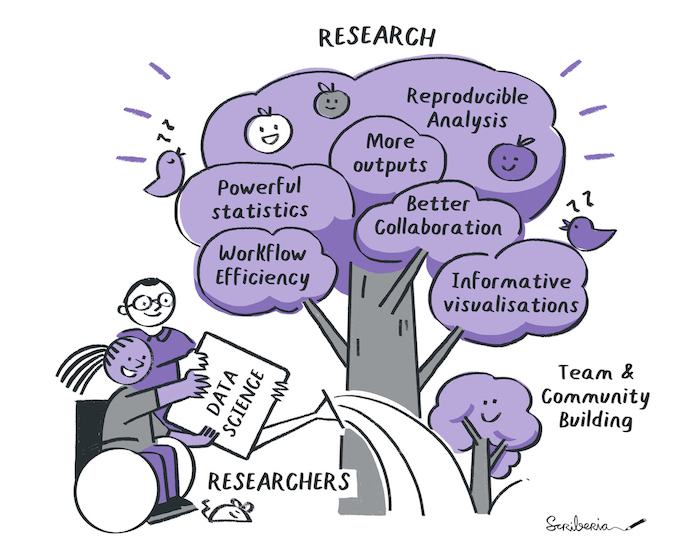
Figure 3. Shows a landscape with different checkpoints fpr data, code, tools and result each of which require reproducible practices. There is a woman explaining her reproducibility journey to help new people start their journey
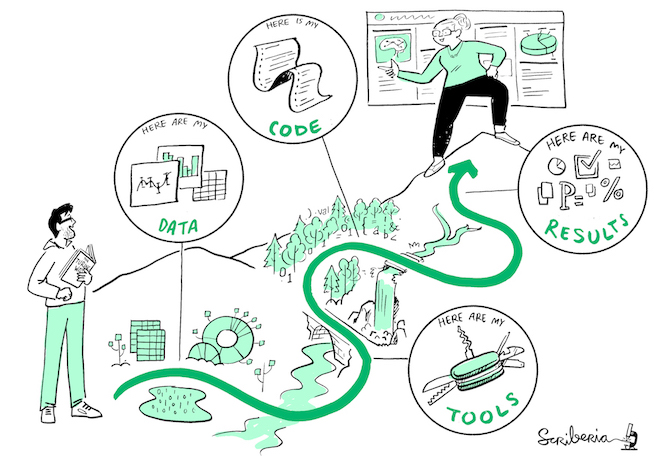
Figure 4. A house representing machine learing and AI is set upon bricks that one person is sliding below the house. On the bricks, we can read data science principles like open science, backups, reproducibiliy, and FAIR principles.
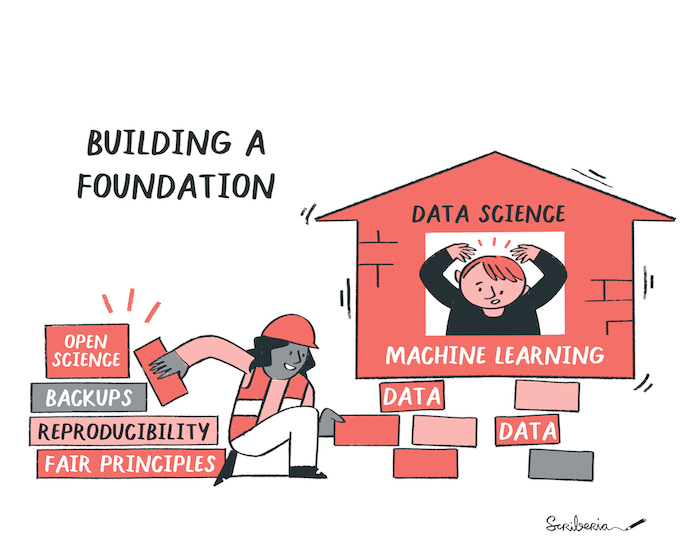
Figure 5. drawing
Setting up a computational project
Figure 1. The research process is represented as a perpetual cycle of generating research ideas, performing data planning and design, data collection, and data processing and analysis, publishing, preserving and hence, allowing re-use of data.
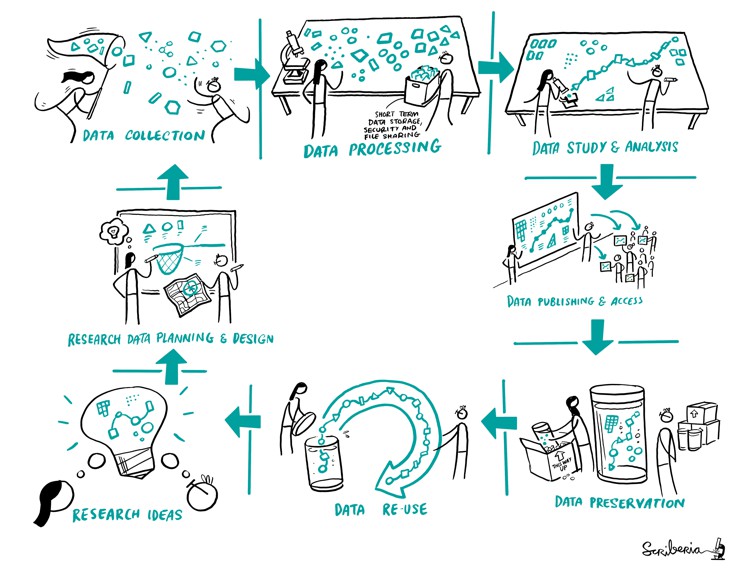
Figure 2. A matrix showing data and analysis in two axis and iterating that reproducibility is when same analysis is applied to same data it gives same result.
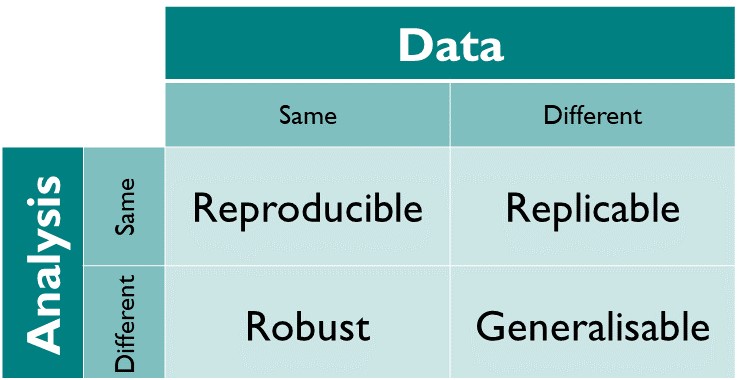
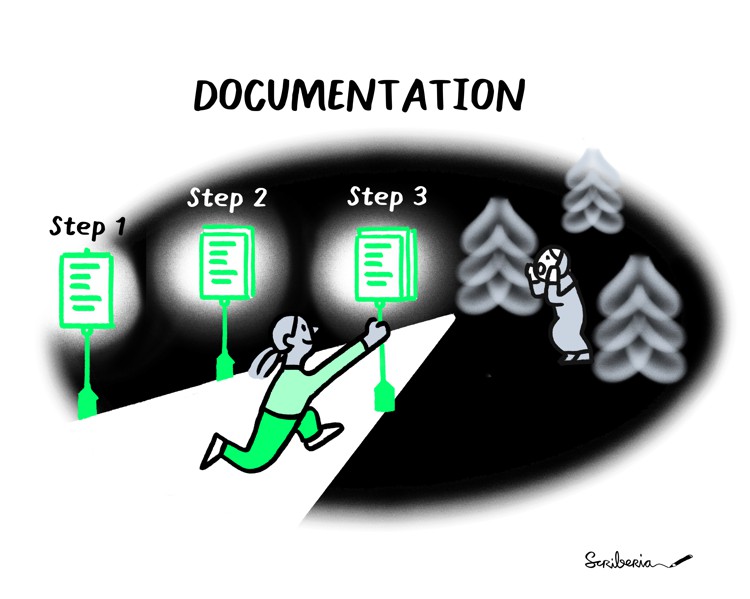
Figure 3. Image shows a person putting lamp-posts of documentation, helping a researcher who was lost because of lack of information about the research.
Version Control and Open Science Practices
Figure 1. Contrast in project history management. On the left - choosing between ambiguosly named files. On the right - picking between successive versions (from V1 to V6).

Figure 2. Image shows a person having internal debate about open vesus closed research. Open means new opportunities and inclusivity but closed maybe required to ensure data sensitivity or wrongly assumed for funding for novel work.

Figure 3. Image shows a woman slowly gaining trust and confidence in opening up her research project and benefitting from open collaboration

Data analysis and results
Figure 1. drawing

Figure 2.

Figure 3. drawing
Figure 4. drawing
Figure 5. box plots

Figure 6. box plots

Figure 7. box plots
Figure 8. box plots
Figure 9. box plots

Implementing tools and methods
Figure 1. drawing
Figure 2. drawing
Figure 3. drawing
Figure 4. drawing
Figure 5. drawing
Figure 6. drawing

Figure 7. drawing

Figure 8.

Figure 9. Ways of capturing computational environments
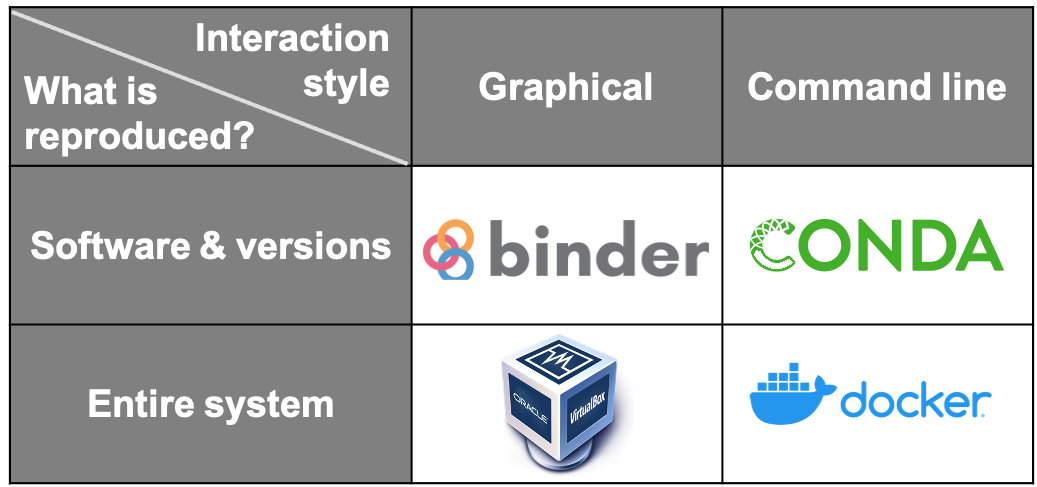
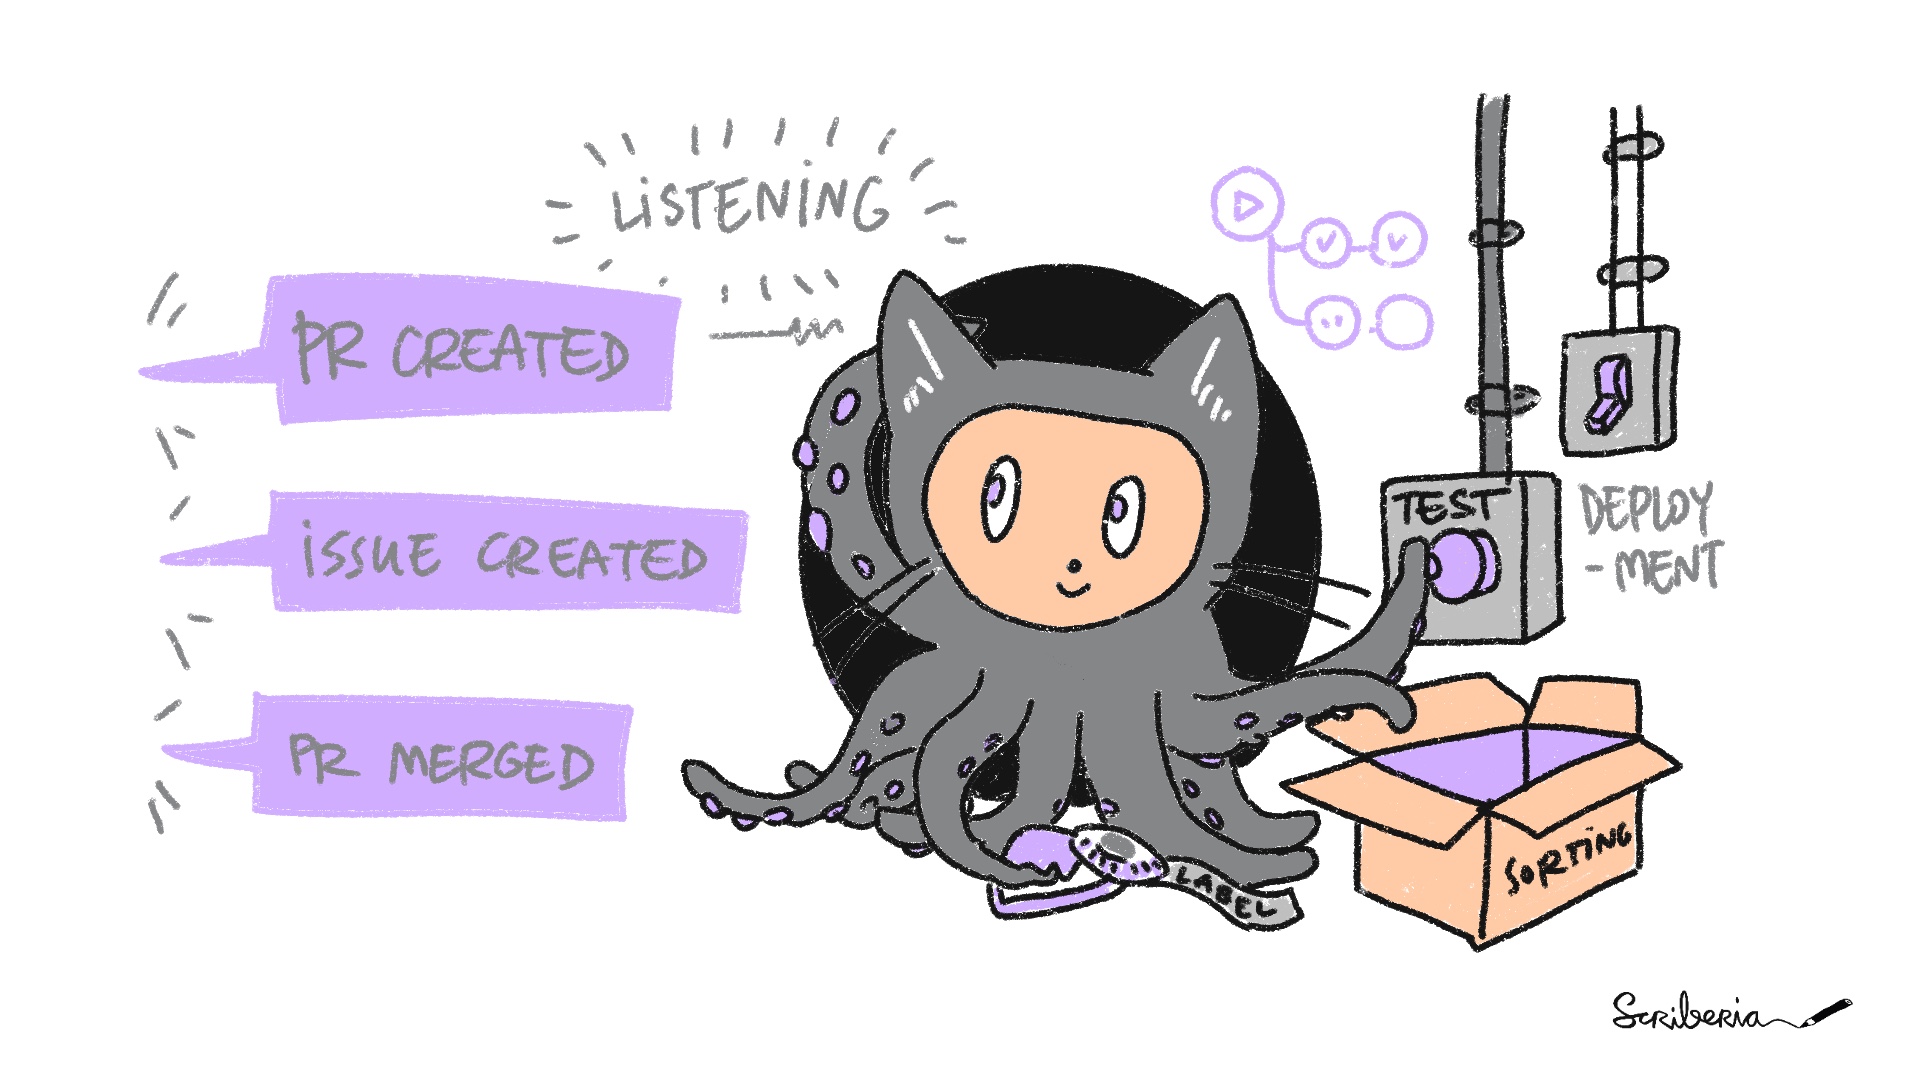
Figure 10. Continuous Integration with GitHub Actions
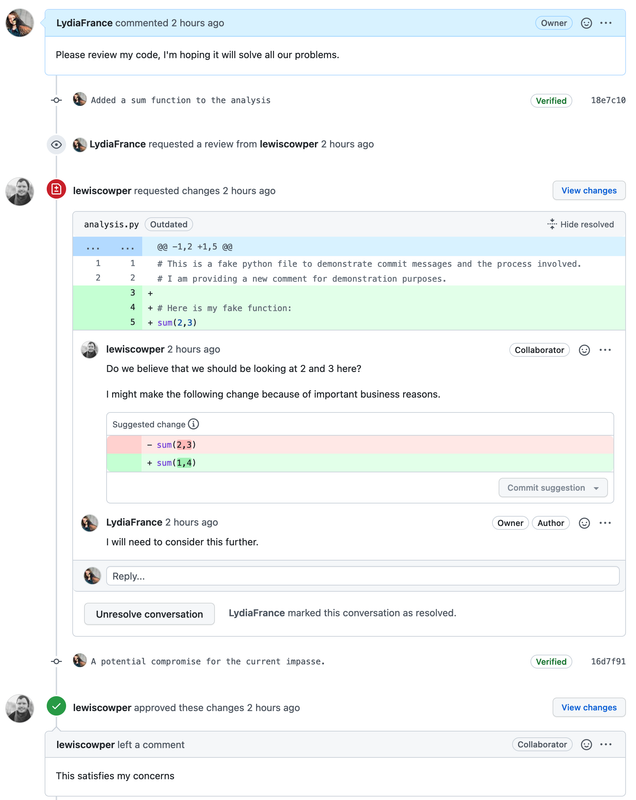
Code Review
Figure 1. Garden of code

Figure 2. drawing
Figure 3. drawing
Figure 4. drawing
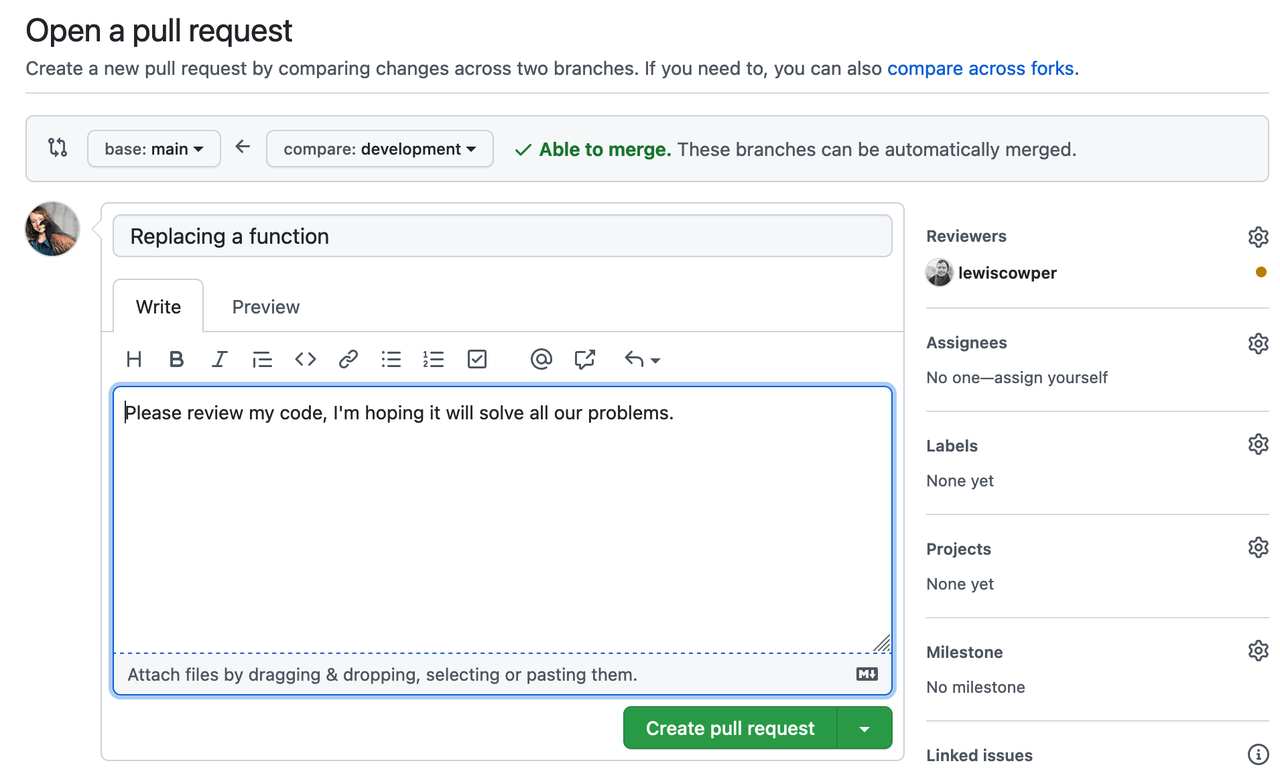
Figure 5. drawing
Publication and release
Figure 1. drawing

Figure 2. drawing

Figure 3. drawing

Figure 4. drawing

Figure 5. drawing

Figure 6. drawing
Figure 7. drawing

Figure 8. drawing
Figure 9.
Figure 10. drawing

Figure 11. drawing
Figure 12. drawing