Introduction to this course
Overview
Teaching: 10 min
Exercises: 0 minQuestions
What is the purpose of this training?
Who are the target audience?
What will they learn at the end of this training?
Objectives
Describe the motivation, purpose, target audience and expected outcome of this training
Managing Open and Reproducible Computational Projects
Over the last decade, several tools, methods and training resources have been developed for early career researchers to learn about and apply data science skills in biomedicine. This is often referred to as biomedical data science, with the following definition.
Biosciences and biomedical researchers regularly combine mathematics and computational methods to interpret experimental data. The term “data science” describes expertise associated with taking (usually large) data sets and annotating, cleaning, organizing, storing, and analyzing them for the purposes of extracting knowledge. […] The terms “biomedical data science” and “biomedical data scientist” […] connote activities associated with the creation and application of methods to new and large sources of biological and medical data aimed at converting them into useful information and knowledge. They also connote technical activities that are data-intensive and require special skills in managing the large, noisy, and complex data typical of biology and medicine. They may also imply the application of these technologies in domains where their collaborators previously have not needed data-intensive computational approaches.
– Russ B. Altman and Michael Levitt (2018). Annual Review of Biomedical Data Science
In contrast to the definition above (and as will be explained in the next chapters), we think research which is not data intensive would also gain in applying data science principles. However, to ensure that data science approaches are appropriately applied in domain research, such as in biosciences, there is a need to also engage and educate scientific group leaders and researchers in project leadership roles on best practices. Computational methods might indeed be as complex as a neural network, but even statistical tests and producing figures for a publication require data science and coding methods.
Researcher use data science skills to apply computation techniques and reproducible data analyses approaches to their research questions. In order to apply these tools, researcher first need to understand and apply the building blocks of data science, especially research data management, collaborative working and project management.
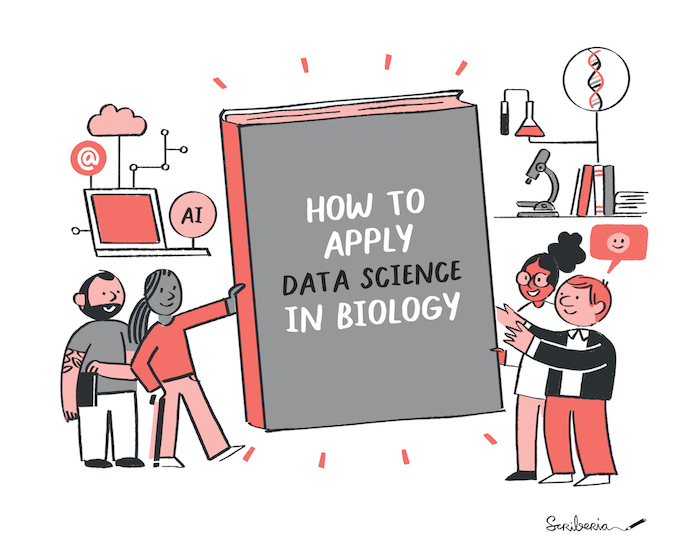
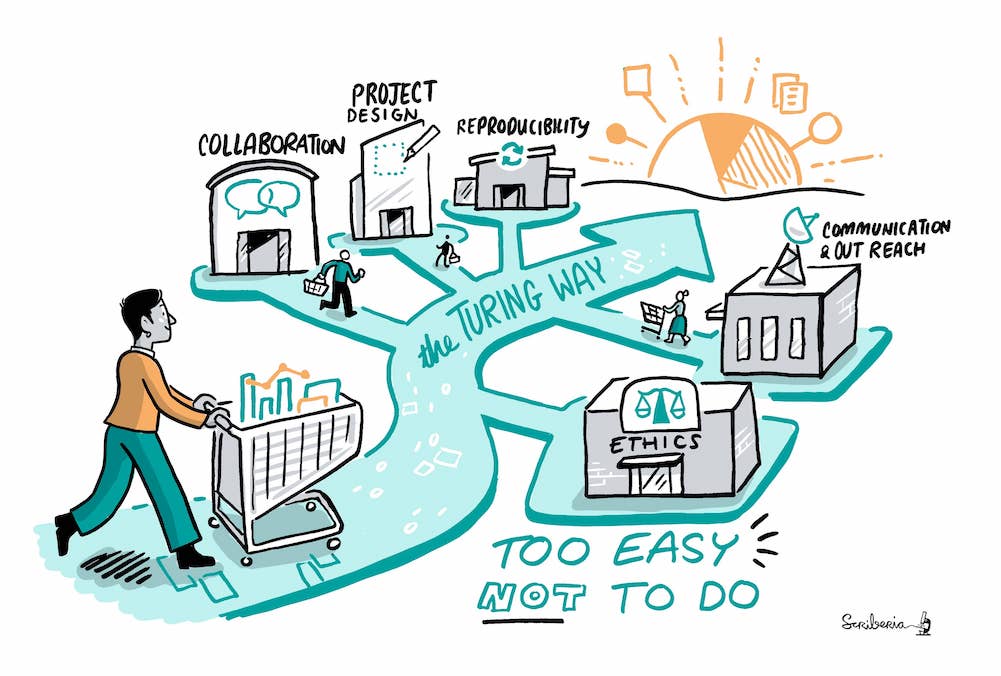
How to apply data science in biology. The Turing Way project illustration by Scriberia for The Turing Way Community Shared under CC-BY 4.0 License. Zenodo. http://doi.org/10.5281/zenodo.3332807
In some instances, it has been argued that “data science” simply rebrands existing fields like statistics or computer science. Our view is that data science has gained traction as an overarching term due to increased data availability and complexity; development of computational methods; advances in computational infrastructure; growing concerns about scientific rigor and the reproducibility of research findings; and a recognition that new advances will result from interdisciplinary research and collaboration. These trends are not unique to data science, but their integration and consolidation under a single term, however broad, reflects an understanding of their interconnectedness and is a real shift in the scientific landscape
- Goldsmith, J., Sun, Y., Fried, L. P., Wing, J., Miller, G. W., & Berhane, K. (2021). The Emergence and Future of Public Health Data Science. Public Health Reviews, 42. doi: 10.3389/phrs.2021.1604023
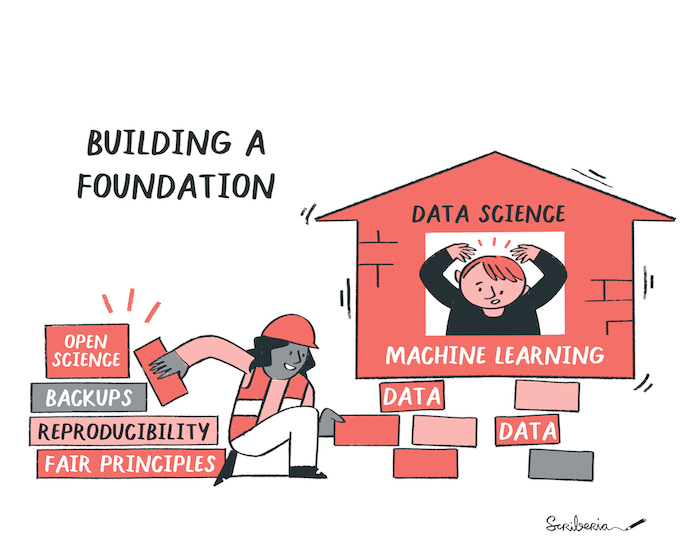
With new technologies supporting the generation of large-scale data as well as successful applications of data science, Machine Learning (ML) and Artificial Intelligence (AI) in biomedicine and related fields have recently shown huge potential to transform the way we conduct research. Recent groundbreaking research utilising AI technologies in biomedicine has led to an enormous interest among researchers in data science, ML and AI approach to extract useful insights from big data, make new discoveries and address biological questions. As pictured below, in order to apply these tools, researcher first need to understand and apply the building blocks of data science, especially research data management, collaborative working and project management.
In what aspects of your projects do you already apply computational and statistical approaches? Do you consider data science relevant for your project? Why/Why not?
The Data Science for Biomedical Scientists project helps address this need in training by equipping experimental biomedical scientists with essential computational skills. In all the resources developed within this project, we consistently emphasise how computational and data science approaches can be applied while ensuring reproducibility, collaboration and transparent reporting.
The goal is to maintain the highest standards of research practice and integrity.
In this training material for learning how to manage computational projects, we discuss essential practices for computational reproducibility required for carrying out meaningful analyses of research datasets through data exploration, processing, visualisation and communication. We present unfamiliar and complex topics from computation and data science to biologists by providing examples and recommendations from their fields. The goal is to enable effective management and sharing of their computational projects. We therefore encourage you to go through this training material before taking our second workshop, more focused in AI and Data Science.
Jargon Busting
Below we provide a simple definition of some terms that we use in this project in the context of scientific research:
- Best Practices: Set of procedures that have been shown by research and experience to produce optimal results and that are established or proposed as a standard suitable for widespread adoption. Definition by Merriam Webster
- Data Science: An interdisciplinary scientific study that uses mathematics and computational tools to extract insights from big structured and unstructured data.
- Computational Project: Applying computer programming and data science skills to scientific research.
- Reproducibility: When the same analysis approach is applied to the same data, it should give the same answer - this answer should be reproduced by others using the same analysis and data originally used.
- Computational Reproducilibity: Reproducing the same result by analysing data using the same source code (in a computer programming language) for statistical analyses.
- Artificial Intelligence (AI): A branch of computer science concerned with building smart machines capable of performing tasks that typically require human intelligence. Definition by Builtin
- Machine Learning (ML): A subset of artificial intelligence that gives systems the ability to learn and optimize processes without having to be consistently programmed. Simply put, machine learning uses data, statistics and trial and error to “learn” a specific task without ever having to be specifically coded for the task. Definition by Builtin
Target audience
Experimental biologists and biomedical research communities, with a focus on two key professional/career groups:
- Group leaders without prior experience with Data Science and ML/AI - interested in understanding the potential additionality and application in their areas of expertise.
- Postdoc and lab scientists - next-generation senior leaders, who are interested in additionality, but also the group more likely to benefit from tools to equip them with the requirements to enable the integration of computational science into biosciences.
Targeted measures and opportunities can help build a better understanding of best practices from data science that can be effectively applied in research and supported by senior leaders. Senior leaders, in this context, can be academics or non-academics working in advisors, experts or supervisors roles in research projects who want to lead rigorous and impactful research through computational reproducibility, reusability and collaborative practices.
Learning Outcomes
At the end of this lesson (training material), attendees will gain a better understanding of:
- Acquiring the necessary/essential basic tools to produce good quality and reproducible computational projects, including AI/ML related
- designing computational projects using collaborative, reproducible and open science approaches
- examining challenges and potential pitfalls in applying best practices in Data Science
- identifying tools and practices required for managing specific kinds of computational projects
- applying a systematic framework introducing computational protocols in their groups as project leads and/or managers
Modular and Flexible Learning
We have adopted a modular format, covering a range of topics and integrating real-world examples that should engage mid-career and senior researchers. Most senior researchers can’t attend long workshops due to lack of time or don’t find technical training directly useful for managing their work. Therefore, the goal of this project is to provide an overview (without diving into technical details) of data science and AI/ML practices that could be relevant to life science domains and good practices for handling open reproducible computational data science.
We have designed multiple modular episodes covering topics across two overarching themes, that we refer to as “masterclasses” in this project:
- Managing and supervising computational Projects (THIS training material)
- Introduction to Data Science and AI for senior researchers
Each masterclass is supplemented with technical resources and learning opportunities that can be used by project supervisors or senior researchers in guiding the learning and application of skills by other researchers in their teams.
Do I need to know biology and AI/ML concepts for this training material?
The short answer is no!
Although the training materials are tailored to the biomedical sciences community, materials will be generally transferable and directly relevant for data science projects across different domains. You are not expected to have already learned about AI/ML to understand what we will discuss in this training material.
In this training material, we will discuss best practices for managing reproducible computational projects, regardless whether they include AI/ML components or not. The training material “Introduction to Data Science and AI for senior researchers” is developed in parallel under the same project that introduces data science, AI and related concepts in detail. Although those are helpful concepts, it is not required to go through that training material to understand the practices we discuss in this training material.
Both the materials discuss problems, solutions and examples from biomedical research and related fields to make our content relatable to our primary audience. However, the best practices are recommended and transferable across different disciplines.
Pre-requisites and Assumptions
In defining the scope of this project, we make the following assumptions about the learner groups, which can be considered pre-requisites for this training:
- Our learners have a good understanding of designing or contributing to a scientific project throughout its lifecycle
- They have identified a computational project with specific questions that will help them reflect on the skills, practices and technical concepts discussed in this training
- This training doesn’t cover the processes of designing a research proposal, managing grant/funding or evaluating ethical considerations for research. However, we assume that learners have a computational project in mind for which funding and research ethics have been approved and comprehensive documentation capturing this information is available to share with the research team.
- We also assume that the research team of any size is (either partially or fully) established, and hence, we will not discuss the recruitment of team members.
Mode of delivery
Each masterclass has been developed on separate repositories as standalone training materials but will be linked and cross-referenced for completeness. This modularity will allow researchers to dip in and out of the training materials and take advantage of a flexible self-paced learning format.
In the future, these masterclasses could be coupled with pre-recorded introduction and training videos (to be hosted on the Turing online learning platform and The Turing Way YouTube channel).
They can also be delivered by trainers and domain experts, who can mix and match lessons/episodes from across the two masterclasses and present them in an interactive workshop format.
Next Steps after this Training
After this masterclass we recommend our learners take these next steps:
- Go through the “Introduction to Data Science and AI for senior researchers” masterclass (if not already completed)
- Explore the set of resources provided at the end of each lesson for deeper dive into various technical topics required to learn or guide the application of Data and computational research best practices in real-world projects
- Establish connections with other training and training materials offered by The Alan Turing Institute, The Crick Institute, The Carpentries, The Turing Way and other projects/organisations involved in the maintenance and development of this training material
- Connect with other research communities and projects in open research, data science and AI that offers opportunities to develop/enhance technical skills
- Collaborate with domain experts such as librarians, research software engineers, community managers, statisticians or people with specialised skills in your organisation who can provide specific support in your project.
Funding and Collaboration
The first iteration of Data Science for Biomedical Scientists, was funded by The Alan Turing Institute’s AI for Science and Government (ASG) Research Programme from October 2021 to March 2022. The project will be further developed and maintained by the members of The Turing Way and Open Life Science community.
This project is previously an extension of The Crick-Turing Biomedical Data Science Awards that strongly indicated an urgent need to provide introductory resources for data science in bioscience researchers. This project extension will leverage strategic engagement between Turing’s data science community and Crick’s biosciences communities.
Pulling together existing training materials, infrastructure support and domain expertise from The Turing Way, The Carpentries, Open Life Science and the Turing ‘omics interest group, we will design and deliver a resource that is accessible and comprehensible for the biomedical and wet-lab biology researchers.
This project will build on two main focus areas of the Turing Institute’s AI for Science and Government research programmes: good data science practice; and effective communication to stakeholders. In building this project, we will integrate the Tools, practices and systems (TPS) Research Programme’s core values: build trustworthy systems; embed transparent reporting practices; promote inclusive interoperable design; maintain ethical integrity and encourage respectful co-creation.
License
All materials are developed online openly under CC-BY 4.0 License using The Carpentries training format and The Carpentries Incubator lesson infrastructure.
Key Points
This material is developed for mid-career and senior researchers in biomedical and biosciences fields.
This training aims to build a shared understanding and facilitate the integration of computational reproducibility in data science.
Better and faster research !
Overview
Teaching: 35 min
Exercises: 0 minQuestions
How does this training relate to your work?
What are the benefits of using data science skills?
What can go wrong with working on data/code?
What are the challenges for teams and management?
Are there procedures and protocols that can help?
Objectives
Understand how this training material will help your research (and career).
Your research project is a computational project.
As a researcher, you are likely to use some sort of computational tools to process, analyse, and visualise data. You are also likely to work on your project with other members of the lab, and the success of your work may well depend on your interactions with your peers. In that sense any research project can be defined as a collaborative, computational project.
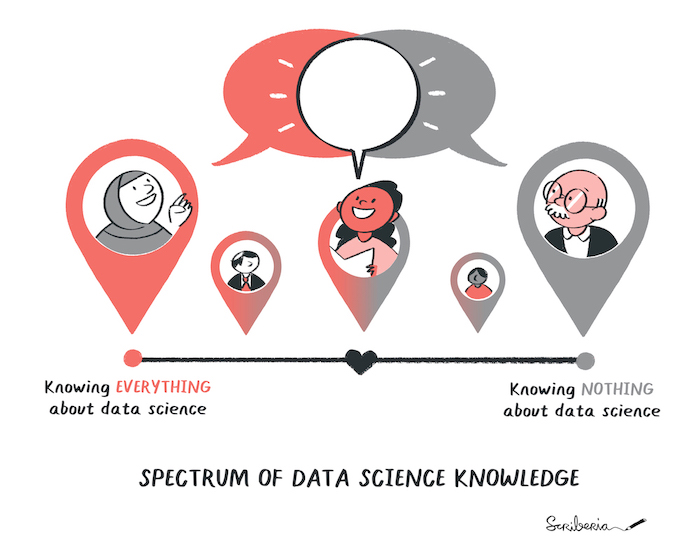
We all may have dfferent research and data science expertise. The Turing Way project illustration by Scriberia for The Turing Way Community Shared under CC-BY 4.0 License. Zenodo. http://doi.org/10.5281/zenodo.3332807
Why are you here
Discuss why you/learners are taking this course, what are the expectations. Does the expectations align with the relevance of data science and content of this course?
Contents of this training material introduces methods and concepts to manage individuals and teams working on any computational project, which in the current era is literally all research projects. It is not about learning how to write code, but building a foundational understanding for computational methods that could be applied to your research. Furthermore, this training will provide guidance for facilitating collaboration and data analysis using tools like research data management, version control or code review.
We acknowledge the data science knowledge will vary. Nonetheless, we believe that the data science skills you will learn in this training will make your research process better. In the following sections, we will detail what we mean by “better”.
How data science will improve your research ?
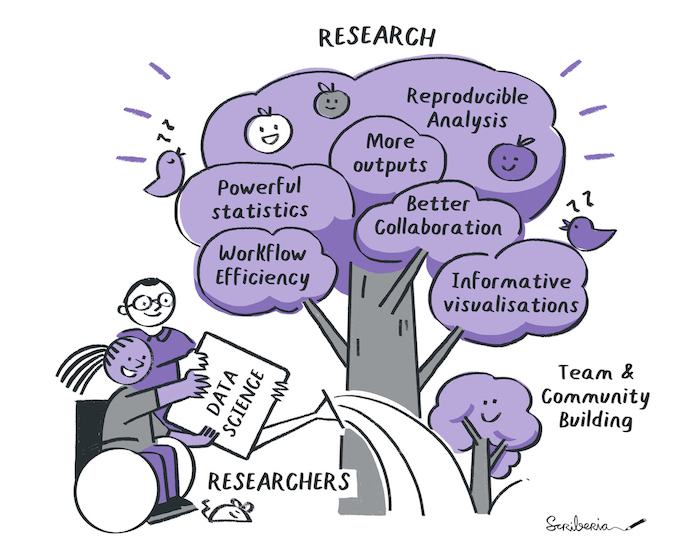
Data science makes research flourish. The Turing Way project illustration by Scriberia for The Turing Way Community Shared under CC-BY 4.0 License. Zenodo. http://doi.org/10.5281/zenodo.3332807
It is mostly about being efficient
Data science brings some structure in how data is collected, processed and analysed, making it easier to collaborate on a project, to publish extra research outputs and leveraging some extra potential your data may have. In the past, it helped me drive new hypotheses, detect problems with the research design early, and reduce the sample size needed to drive a solid conclusion. Eventually, it made my research more robust and trustworthy. But in the end, my real motivation is efficiency: very soon, the time I invested in learning and applying data science in my research was recovered multiple times when a manuscript had to be written (and re-written).
There are different ways to organise the different foreseen improvement, we decided here to start with improvement in the final result, improvement in the research process, and finally aspects of community building.
Using code for nicer paper
Powerful statistics
The most advanced statistical methods (like machine learning) are first developed in programming environment, and they are often difficult or impossible to implement in statistical software. In addition, some of the less advanced statistical methods requires intensive data processing that makes it very difficult to apply outside a coding environment.
Examples
- logarithmic.net/langevitour/2022-useR/#2 to explore orthonormal projections of high dimensional data.
- Results of water maze behavioural tests are better analysed using a survival analysis than an Analysis of variance (ANOVA). However, the data obtained via video analysis software is often not fitted for that analysis and needs to be transformed. Doing transformations by hand is time consuming and is likely to introduce errors.
Example’s references
- See Jahn-Eimermacher, A., Lasarzik, I., & Raber, J. (2011). Statistical analysis of latency outcomes in behavioral experiments. Behavioural Brain Research, 221(1), 271–275. doi: 10.1016/j.bbr.2011.03.007
- For water maze experiment analysis, see: Maugard, M., Doux, C., & Bonvento, G. (2019). A new statistical method to analyze Morris Water Maze data using Dirichlet distribution. F1000Research, 8(1601), 1601. doi: 10.12688/f1000research.20072.2.
Informative (and inclusive) figures
Once you start using code for analysing your data, it will become much easier to do complex and informative visualisation. This often includes way to visualise and label single data points, or use visualisation on several dimensions (producing moving gifs of a 3D scatterplot for instance).
One can also automate the figure design choice, so that all figures look similar. Similarly, the production of several version of the same figure is very easy. For example, one can use different color pallette, one using the palette usually used in the field (the one your supervisor wants to see), and one for color-blind readers.
Single flights from different bees.
See a good example of data representation in differen format single flights from different bees shown in supplemnentary data: Menzel, R., Greggers, U., Smith, A., Berger, S., Brandt, R., Brunke, S., …Watzl, S. (2005). Honey bees navigate according to a map-like spatial memory. Proceedings of the National Academy of Sciences of the United States of America, 102(8), 3040. doi: 10.1073/pnas.0408550102
Reproducible analysis
Good scientific practices are aiming at securing the robustness and reproducibility of the scientific endeavour. As a researcher, assuring computational reproducibility of your results is a relatively easy step in making your research more robust.
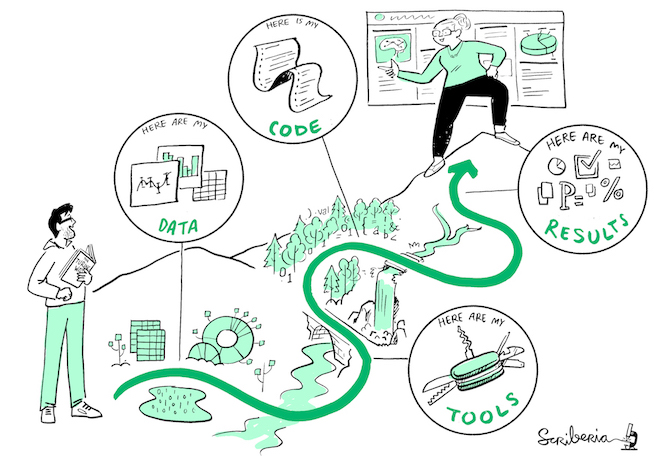
What to expect in your reproducibility journey. The Turing Way project illustration by Scriberia for The Turing Way Community Shared under CC-BY 4.0 License. Zenodo. http://doi.org/10.5281/zenodo.3332807
The reproducibility of an experiment not only requires a detailed description of the methods and reagents used, but also a detailed description of the analysis performed. The ultimate description of the analysis is to provide all elements necessary for reproducing the analysis (computational reproducibility). This includes the data and the code used to analyse it (in a form that can be reused in a different computational environment).
In practice, sometimes one may not be able to provide all elements openly (for instance, some medical data cannot be shared openly for privacy reasons) for everyone to be able to reproduce all the results. But co-workers (and maybe reviewers) should be able to reproduce the analysis (e.g., on anonymized data).
The emergence of reproducible reports is another aspect of computer reproducibility. Literate programming using Jupyter notebooks, Rmarkdown, stencila or quarto (tools that can usually use Python, R, or Julia) is indeed growing in popularity. These tools allow you to show data and analysis side by side, with written explanations and interactive visualisations. These outputs can not only be used as blog posts, or lab reports, but can also be published as an enhanced publication, a concept called executable research articles: https://gmaciocci.medium.com/list/the-evolution-of-executable-research-articles-823e42a9fa60
Diversifying research outputs
While the main recognition currency in academia is still (first) authorship in peer reviewed publication, new scientometrics are developed to recognize publication of other research outputs. In particular, datasets and software publication are officially reviewed in the evaluation of certain grant, for example for the Marie-curie european program. Data science principles will make it easier to publish datasets, software, reagents or hardware you are anyway producing during the research process.
By publishing datasets and code, you will not only help other researchers, but gain extra recognition for your work. However, open data and open code requires a specific documentation, which we will touch upon in this training.
Computational tools you produce in your lab can be released as open source software and credit will be given globally. This may also be true for hardware you design (this aspect will not be discussed in this training) or datasets you collect.
Improved Research Process
Data quality
Did you know that manually copy-pasting data is one of the primary source of data corruption ? Combining datasets or processing data (such as cleaning or transforming into different formats), can therefore be best achieved using code. The process is not only safer, but it is often faster.
Another underevaluated issue is the amount of data you will collect. The more data you have the more sophisticated tools and workflows you may need. It is also more likely that your data (or code) gets corrupted, mixed up, outdated, or lost. In particular, when something goes wrong during the experiment, code might be used to create warnings, so that the setup or protocol may be modified on the fly or between sessions.
Reproducibility and automation
While we already mentioned the advantage of reproducibile analysis for the quality of the research, we did not mention how useful this is during the research. With reproducible analysis, it is effortless to run a new dataset in the analysis workflow, it becomes possible to explore the data at a single experiment level, which may enable new hypotheses, or spot issues that were not foreseen in the experimental design. It makes also certain that difference in the figures are due to difference in the dataset, not any manual processing of the data one may have forgotten to docuzment.
Collaborative working
Within science teams, group work is critical for experimental design and implementation. In addition, there are rapid developments in how scientific results and methods are shared, and collaborations have never been more global or rapid. This means that several people will likely be working with the same data files.
Data science allows for the management of how one or multiple people work on the same project (as well as the same code). It requires different skillsets than those taught in traditional science courses or a typical coding class.
Who can add to your research?
Facilitating communication and sharing will make it easier for your colleagues to help you. Can you think of people who can help you in your research, directly in your lab or at your institution ? Would it help for them to have access to your data? How could they participate, and how can you give them credit?
Needs from the future you
It is very interesting to consider your future self as one collaborator in your project. Anything you may forget in the next three to five years should be documented, if you want your future self to be able to (re-)analyse the data you are collecting. Indeed, the advantage of working collaboratively in a project can indeed be translated directly in a project you drive mostly alone.
Efficiency
The time invested in your data and code will be paid multiple times by the efficiency improvement in your workflow, if that investment is done early in the project. Because one can consider your past self as one of your collaborator, the advantage of working collaboratively in a project can indeed be translated directly in a project you drive mostly alone.
At this point, you may be convinced that the extra work of designing your project using data science principles will be worth it. But here comes the best argument of all: in the end you will save time. Early time saving comes because your future self and collaborators will be able to find all your data, reuse and modify your code, and understand your research faster.
This applies directly to the example of working on article revisions - will you still remember all the analysis details and data nuances when your papers comes back with a request for major changes? For instance, if a colleague cannot find what data goes with which figures, there are high chances that you will also be unable to find it three years from now. In addition, itt is not uncommon to modify the design of the figures multiple times (sometimes back and forth), often modifying all figures at once.
Redoing all figures in minutes
Once a reviewer ask me to overlay individual data points onto all our 5 boxplots figures. The project was an old one, and I had not touched the data for years. Finding the right data and redo the all 5 figures would usually take ages using SPSS or excel. But since I used code, I had all figures 15 minutes later. (Note, after seeing the new figures, the reviewer agreed that the original version was better).
Later on in the project, community advantages are coming in. Data and code reusability is not only a mark of research transparency and robustness, it also means you can reuse your own code and data. It also means you can reuse code and data produced by other researchers.
The snow ball effect may be huge, and the objective of this course is to allow you to do better science in less time
Invest in data science
As an example it was estimated that research data management takes about 5% of your time, on the other hand, time lost due to poor data management is estimated to be 15%. See reference: Lowndes, J. S. S., Best, B. D., Scarborough, C., Afflerbach, J. C., Frazier, M. R., O’Hara, C. C., Halpern, B. S. (2017). Our path to better science in less time using open data science tools. Nature Ecology & Evolution, 1(0160), 1–7. doi: 10.1038/s41559-017-0160
Team and community building
Data science foundations. The Turing Way project illustration by Scriberia for The Turing Way Community Shared under CC-BY 4.0 License. Zenodo. http://doi.org/10.5281/zenodo.3332807
Data science tools will make it easier not only to collaborate with researchers in your lab, but also with researchers outside of your lab, or even with non-researchers (citizen science or software professionals). These may bring valuable expertise in the project. Being part of a collaborative community will also create impact beyond citations and papers, something which starts to be valued by funding agencies, and which make research more fun, valued and interesting.
We may also add to the pot that creating a network around your research is a critical aspect of building a career in academia. Being known as a good and skilled collaborator can open doors to many opportunities.
A journey starts
You step into the Road, and if you don’t keep your feet, there is no knowing where you might be swept off to.
J.R.R. Tolkien, The Lord of the Rings
This training will give you some starting points, but implementating data science principles is a long and always renewed process. But you do not need to do it all at once, and you do not need to do it alone.
After the training, do not hesitate to join (or create) a community of like-minded researchers where you live (there are always some if you look). In addition, there may be people at your institution whose job is to help you. Look for data steward or data managers, research data engineers, IT support, open science büros at your institution and be pro-active contacting them. There are also almost endless online resources and helpful communities. For instance, The Turing Way guide for data science and research provides several detailed chapters to cover topics across reproducibility, project design, collaboration, communication, research ethics and community building.
The Turing Way project illustration by Scriberia for The Turing Way Community Shared under CC-BY 4.0 License. Zenodo. http://doi.org/10.5281/zenodo.3332807
References
- A Quick Guide to Organizing Computational Biology Projects Noble WS (2009) A Quick Guide to Organizing Computational Biology Projects. PLOS Computational Biology 5(7): e1000424. https://doi.org/10.1371/journal.pcbi.1000424
- Seddighi, M, Allanson, D, Rothwell, G, Takrouri, K. Study on the use of a combination of IPython Notebook and an industry-standard package in educating a CFD course. Comput Appl Eng Educ. 2020; 28: 952– 964. https://doi.org/10.1002/cae.22273
- Mendez, K.M., Pritchard, L., Reinke, S.N. et al. Toward collaborative open data science in metabolomics using Jupyter Notebooks and cloud computing. Metabolomics 15, 125 (2019). https://doi.org/10.1007/s11306-019-1588-0
Key Points
motivations
Setting up a computational project
Overview
Teaching: 20 min
Exercises: 0 minQuestions
How to set up a computational project?
What main concerns and challenges exist and how to address them?
How to create a project repository for sharing, collaboration and an intention to release?
Objectives
Describe best practices for setting a project repository
Build a basis for collaboration and co-creation in team projects
Apply computational reproducibility and project management practices
Make it easy for each contributor to participate, contribute and be recognised for their work
Setting up a Project
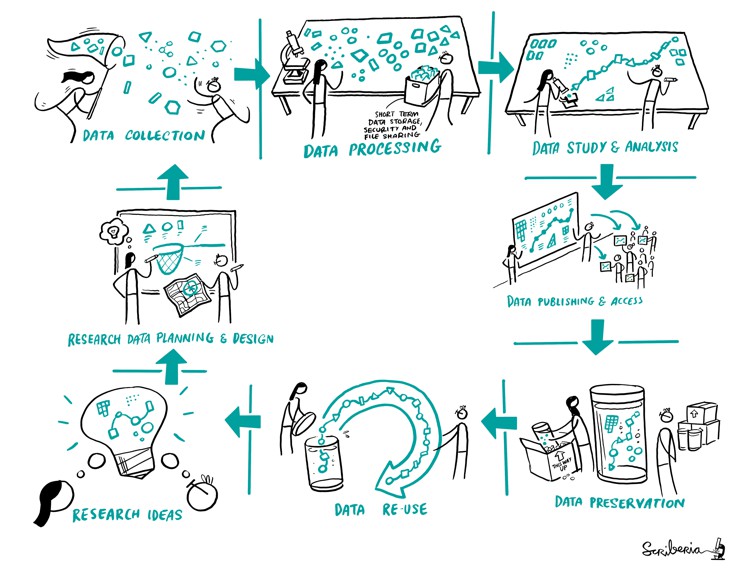
Research Lifecycle. The Turing Way project illustration by Scriberia for The Turing Way Community Shared under CC-BY 4.0 License. Zenodo. http://doi.org/10.5281/zenodo.3332807
A research project starts right with a research idea. We start by communicating that with other researchs in our team. Then come the following steps:
- planning and designing the research work
- describing the research protocols
- deciding how data will be collected
- selecting methods and practices for processing and wrangling data
- conducting our studies and analysis
- publishing all the research objects so everybody can access it
- archiving it to ensure that our research is reusable, meaning, that someone else can go through this whole process of reproducing or building upon our work.
Each of these steps is important for every single researcher, irrespective of their roles in the project. However, a project lead (such as Principal Investigators, managers and supervisors) have an added responsibility to set up the project in a way that ensures that all members of their research team can work together efficiently at all stages of the project.
With an overarching goal to maintain research integrity and ethical practices from the start, we need to consider reproducibility methods, collaborative approaches and transparent communication processes for the research team as well as the external stakeholders. As project leads, managers and team organisers, it is crucial to be deliberate and clear about the tools and platforms selected for the project, as well as expectations from each contributor from the beginning. Dedicating some time in thinking through and documenting the setup of a project saves time, ensuring successful implementation of research plans at different stages of research. At this stage, you can’t be sure that everything will always go as planned or there will be no unexpected challenges, but it helps prepare in advance for risk management and adapt to changes when needed.
Main Concerns and Challenges
Scientific results and evidence are strengthened if those results can be replicated and confirmed by several independent researchers. This means understanding and documenting the research process, describing what steps are involved, what decisions are made from design to analysis to implementation stages and publishing them for others to validate. Research projects already start with multiple documents such as project proposal, institutional policies and recommendations (including project timeline, data management plan, open access policy, grant requirements and ethical committee recommendations), which should be available to the entire research team at all times. Furthermore, throughout the lifecycle of a project we handle experimental materials such as data and code, refer to different published studies, establish collaboration with others, generate research outputs including figures, graphs and publications, many of which undergo multiple versions. Then there is a general need to document the team’s way of working, different roles and contribution types, project workflows, research process, learning resources and templates (such as for presentation, documentation, project reporting and manuscript) for your research team.
If not planned in advance, these different kinds of information related to the project can become challenging to record, manage or retrieve – costing precious time of everyone involved and negatively affecting collaborative work in your research team.
Shared Repository to Share Information
To manage collaborative research in computational projects with mainly distributed systems (different computers, cloud infrastructure, remote team members) it is essential to provide clear guidelines on where these digital objects should be held, handled and shared. Therefore, the first step is to establish a shared digital location (centralised, findable and accessible) like a shared drive (cloud-based or organisation-hosted server space) or online repository where all project related documentation and resources can be made available for everyone in your research team. When introduced with clear guidance for how everyone in your team can contribute to keeping the shared repository up-to-date, it helps build a sense of collaboration from the start. You can use this repository also to communicate what policies are relevant for people and their work in the project; how data, code and documentation are organised; and how peer-review, open feedback and co-creation will be enabled at all stages of the project.
Versioning
No matter how your group is organized, the work of many contributors needs to be managed into a single set of shared working documents. Version control is an approach to record changes made in a file or set of files over time so that you and your collaborators can track their history, review any changes, and revert or go back to earlier versions. Management of changes or revisions to any types of information made in a file or project is called versioning.
We have all seen a simple file versioning approach where different versions of a file are stored with a different name. Tools such as Google Drive and Microsoft Teams offer platforms to update files and share them with others in real-time, collaboratively. More sophisticated version control system exists within tools like Google docs or HackMD. These allow collaborators to update files while storing each version in its version history (we will discuss this in detail). Advanced version control systems (VCS) such as Git and Mercurial provide much more powerful tools to maintain versions in local files and share them with others.
Web-based Git repository hosting services like GitLab and GitHub facilitate online collaborations in research projects by making changes available online more frequently, as well as enabling participation within a common platform from colleagues who don’t code. With the help of comments and commit messages, each version can explain what changes it contains compared to the previous versions. This is helpful when we share our analysis (not only data), and make it auditable or reproducible - which is good scientific practice. In next chapters we discuss version control for different research objects.
You can read more details in Version Control and Getting Started With GitHub chapters in The Turing Way.
Vision, Mission and Milestones
It is particularly important to share the project’s vision, mission and milestones transparently. Provide sufficient information for what the expected outcomes and deliverables are. Provide overarching as well as short-term goals and describe expected outcomes to help contributors move away from focusing on a single idea of the feature. Describe the possible expansion of the project to give an idea of what to expect beyond the initial implementation. All proposed plans for the project with information on available resources and recommended practices to ensure everyone is on the same page.
Role and Responsibilities
Create a folder/directory to give information about the different stakeholders with their roles in the project, key skills, interests and contact information (when possible). Describe what responsibilities and opportunities for collaboration different members will have. Provide resources on ways of working to ensure fair participation of stakeholders who collaborate on short- and long-term milestones within the project. It reduces or addresses concerns about the project’s progress towards meeting goals and prevent potential fallout between project stakeholders. When possible, such as in an open source project, provide these details for those outside the current group, especially when you want to encourage people outside the project to be involved.
Start with an intention to Release
- Structure and logically organise project folders and files using the consistent convention for individual file names, making them easy to locate, access and reuse.
- Review and consider how research needs to be disseminated at the end of the project as per the grant as well as institution requirements and policies.
- Choose and determine license types for different research objects such as data, software, and documentation.
- Embed computational reproducibility through skill-building in your team (see version control, computational environments, code testing, software package management).
- Add documentation process to project timelines and milestones for capturing progress, blockers and contributions by all stakeholders, making your research objects easy to attribute and release.
Choose a License
Research does not have to be completed to be useful to others. Having a license is the way to communicate how do you want your research to be used and shared. There are different types of licenses depending on the type of research objects such as code, data or documentation and preferences for re-use and sharing. The choosealicense website has a good mechanism to help you pick a license. To learn more about how to add a license to your project, read the Licensing chapter in The Turing way Guide for Reproducible Research.
Consider Computational Reproducibility
Documentation as a guiding light for people who may feel lost otherwise. The Turing Way project illustration by Scriberia for The Turing Way Community Shared under CC-BY 4.0 License. Zenodo. http://doi.org/10.5281/zenodo.3332807
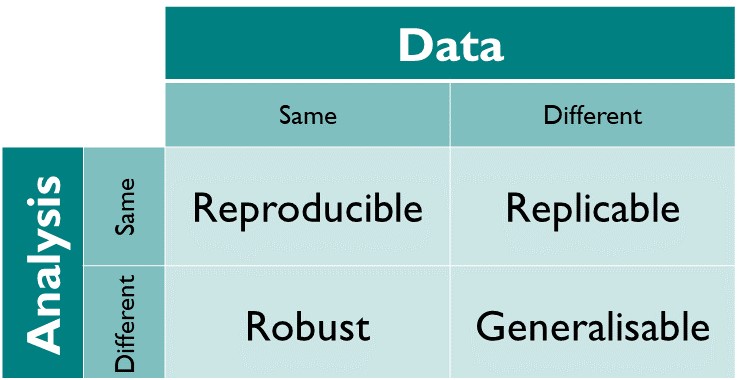
The different dimensions of reproducible research described in the matrix above have the following definitions directy taken from The Turing Way Guide to Reproducible Research (see the oveview chapter):
- Reproducible: A result is reproducible when the same analysis steps performed on the same dataset consistently produces the same answer.
- Replicable: A result is replicable when the same analysis performed on different datasets produces qualitatively similar answers.
- Robust: A result is robust when the same dataset is subjected to different analysis workflows to answer the same research question (for example one pipeline written in R and another written in Python) and a qualitatively similar or identical answer is produced. Robust results show that the work is not dependent on the specificities of the programming language chosen to perform the analysis.
- Generalisable: Combining replicable and robust findings allow us to form generalisable results. Note that running an analysis on a different software implementation and with a different dataset does not provide generalised results. There will be many more steps to know how well the work applies to all the different aspects of the research question. Generalisation is an important step towards understanding that the result is not dependent on a particular dataset nor a particular version of the analysis pipeline.
Thinking about which software, tools and platforms to use will greatly affect how you analyse and process data, as well as how you share your results for computational reproducibility. The idea is to facilitate others in recreating the setup process necessary to reproduce your research.
Some tools that can be used to enable these are the following:
- Dependency managers such as Conda keep dependencies updated and make sure the same version of dependencies used in the development environments are also used when reproducing a result.
- Containers such as Docker is a way to create computational environments with configurations required for developing, testing and using research software isolated/independent from other applications.
- Literate Programming using Jupyter Notebook is an extremely powerful way to use a web-based online interactive computing environment to execute code and script while adding notes and additional information about the application. To learn more about how to create a reproducible environment, the chapter on Reproducible Environments in The Turing way is a good place to start.
Provide a Process for Documentation
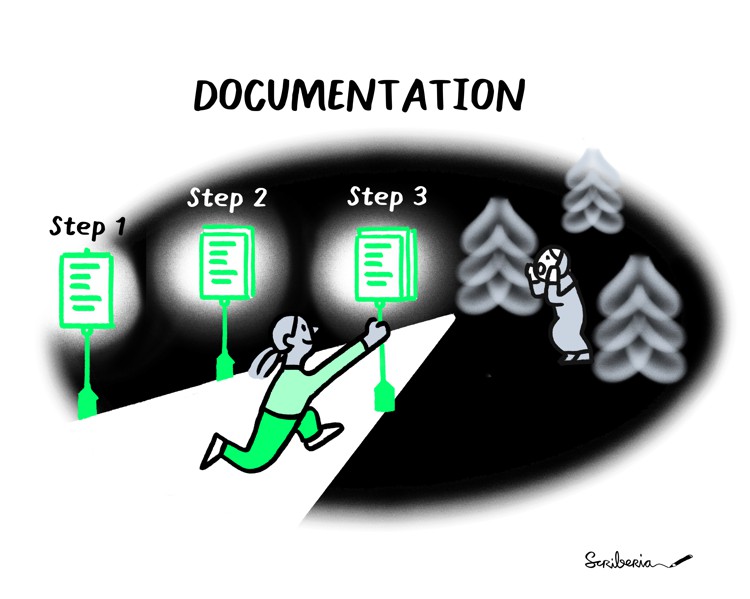
Documentation as a guiding light for people who may feel lost otherwise. The Turing Way project illustration by Scriberia for The Turing Way Community Shared under CC-BY 4.0 License. Zenodo. http://doi.org/10.5281/zenodo.3332807
Most researchers find documentation daunting, as they think that research-related responsibilities are already overwhelming for them. It’s obvious that they see documentation as an ‘added labour’ and not important enough for carrying out a research design, implementation, analysis or publication work.
The reality is that documentation is an integral part of all research processes, from start to finish.
A systematic process for documentation is more than a formal book-keeping practice because it:
- allows everyone in your research to understand the research direction and track progress;
- adds validity to your research work when systematically built on published peer-reviewed work;
- communicates different ways to contribute, enabling diverse participation in the co-development;
- upholds practices to ensure equity, diversity and inclusion;
- recognises contributions fairly;
- gives and shares credits for all work;
- tracks the history of what worked or what did not work;
- creates transparency about early and intermediate research outcomes;
- makes auditing easy for funders, advisors or data managers;
- helps reframe research narratives by connecting different work;
- explains all decisions and stakeholders impacted by that;
- gives the starting point for writing manuscript and publication; and more!
Facilitating Documentation in your Team
NOTE
Whatever your approach is, be firm about making documentation a shared responsibility so that this job does not solely fall on the shoulders of early career researchers, members from traditionally marginalised groups or support staff.
The biggest question here is probably not ‘why’ but ‘how’ to facilitate documentation so that it is not challenging or burdensome for the team members. Here are a few recommendations to make documentation easier:
- Allocate some time at the beginning of the project to discuss with the main stakeholders of the project about what should be documented.
- Keep the tasks simple by establishing a shared repository for documentation with standard templates to guide how one should go about documenting their work (It is always easier to start with a template than an empty sheet!).
- Add documentation sprint to your project timelines and milestones to make sure that everyone is aware of their importance in the project.
- Create visible ways to recognise and incentivise the process of documenting.
Team Framework
To ensure that all team members have a shared understanding of ways of working, select or adapt a Team Framework that provides guidance on how to best work in your team. For instance, Agile workflow for teamwork enables iterative development, with frequent interaction between interested parties to decide and update requirements. See Teamwork for Research Software Development tutorial by Netherlands eScience Center with lessons on teamwork, agile and scrum framework, project board such as kanban, challenges and practical recommendations.
Registered Report
After you have decided how to collect your data, analyze it and which tools to use, a good way to document these decisions is by writing a Registered Report. A Registered Report highlights the importance of the research question and the methods that will be used. They are peer-reviewed before the research, switching the focus of the review from the results to the substance of the research methods.
Conclusion
In addition to ensuring effective development and collaboration during the lifetime of the project, a well-organised project also ensures sustainability and reusability of research for both the developers and future users more dynamically. This aspect is discussed in detail in the Research Data Management episode.
Resources and References for Technical Details
- The Turing Way. The Turing Way Community. (2021). The Turing Way: A handbook for reproducible, ethical and collaborative research (1.0.1). Zenodo. DOI: 10.5281/zenodo.5671094
- The Good Research Code Handbook by Patrick Mineault.
- Open Life Science training and Mentoring Programme. Batut, Bérénice, Yehudi, Yo, Sharan, Malvika, Tsang, Emmy, & Open Life Science Community. (2021). Open Life Science - Training and Mentoring programme - Website release 2019-2021 (1.0.0). Zenodo. DOI: 10.5281/zenodo.5636584
Key Points
Shared repository with well structured and organised files are crucial for starting a project
Documentation is as important as data and code to understand the different aspects of the project and communicate about the research.
Licencing and open science practices allow proper use and reuse of all research objects, hence should be applied in computational research from the start.
Research Data Management
Overview
Teaching: 20 min
Exercises: 0 minQuestions
What is considered research data?
How to start building a research data management plan?
What is FAIR principles for data management?
Why care about documentation and metadata standards?
Objectives
Describe research data management (RDM)
Explain FAIR principles and practices for RDM
Introduce data storage and organisation plan
Discuss documentation and metadata practices
Research Data Management
Main Challenges and Concerns
Need to consider standard file formats for future use of data!
Electron Microscope Facility in our institute has produced around 5 petabytes (5,000,000 GB) of data since the institute opening. These files are stored safely and privately, and have not been standardised. As a result they are in danger of being lost forever, stored but never used. With metadata, this could form a transformative training data set for machine learning tools and possibly lead to new discoveries and insights. Creating Alpha Fold and other machine learning/AI tools you need large data sets. Meta data allows data to be future proofed for further research and even innovative research not currently possible.
Overview of Research Data Management
Research Data Management (RDM) covers how research data can be stored, described and reused. Data here is used as a generic term to encompass all digital objects. RDM is a vital part of enabling reproducible research. RDM ensures efficiency in research workflows, and also greater reach and impact, as data become FAIR (Findable, Accessible, Interoperable and Reusable). Data should be stored in multiple locations and backed up regularly to prevent loss or data corruption.
Why This is Useful
Managing your data allows you to always find your data and ensure the quality of scientific practice or research. Storing your data properly and backing up regularly prevents data loss. It can help with recognition for all research outputs. It stimulates collaboration with others, who will find it easier to understand and reuse your data. RDM is cost/time efficient, as you will always be able to find and use your data.
Clearly describing data using documentation and metadata ensures that others know how to access, use and reuse your data, and also enable conditions for sharing and publishing data to be outlined.
Documentation and Metadata
Having data available is of no use if it cannot be understood. Therefore research data should always include consistent documents and metadata.
Data documentation provides contexts and full description about the data. It allows your collaborators, colleagues and future you to understand what has been done and why. Ideally written in clear and plain language, documentation describes data with sufficient information such as source, strengths, weaknesses, and analytical limitations of the data allowing users to make informed decisions when using it.
Without metadata to provide provenance and context, the data can’t be used effectively. Metadata is information about the data, descriptors that facilitate cataloguing data and data discovery. Often, metadata are intended for machine reading. When data is submitted to a trusted data repository, the machine-readable metadata is generated by the repository. If the data is not in a repository a text file with machine-readable metadata can be added as part of the documentation.
- The type of research and the nature of the data also influence what kind of documentation is necessary. It is best practice to use recognised community metadata standards to make it easier for datasets to be combined.
- The level of documentation and metadata will vary according to the project type and the range of stakeholders, including the future users.
- Examples of documentation may include items like data dictionaries or codebooks, protocols, logbooks or lab journals, README files, research logs, analysis syntax, algorithms and code comments.
- Variables should be defined and explained using data dictionaries or codebooks.
- Data should be stored in logical and hierarchical folder structures, with a README file used to describe the structure.
REMBI: Example of metadata in bioimaging data
REMBI: Recommended Metadata for Biological Images—enabling reuse of microscopy data in biology, Sarkans, U., Chiu, W., Collinson, L., Darrow, M. C., Ellenberg, J., Grunwald, D., …Brazma, A. (2021). Nature Methods, 18(12), 1418–1422. doi: 10.1038/s41592-021-01166-8
Bioimaging data have significant potential for reuse, but unlocking this potential requires systematic archiving of data and metadata in public databases. Cryo-EM and cryo-ET have proven to be powerful tools for determining high-resolution structures of biological matter and examining the functional cellular context of macromolecular complexes.
REMBI is a draft metadata guidelines to begin addressing the needs of diverse communities within light and electron microscopy. The current version of REMBI, including examples from the fields covered by the three working groups is shared online via http://bit.ly/rembi_v1.
Defining Data
Data are objects that you use and produce during your research life cycle, encompassing data sets, software, code, workflow, models, figures, tables, images and videos, interviews, articles. Data are your research asset. A good way of thinking about what might be classed as data that needs to be managed is to ask yourself the questions:
- What is the information that I need to use and write about in my paper or book?
- What information would I need to back up my conclusions?
- What information is needed by others to understand and possibly replicate the research that I have done? This information is your data.
The Research Data Lifecycle - A Model for Data Management
Research data often follows a ‘lifecycle’ that follows the research project as it evolves. This model provides a sound basis on which to plan for research data management, from data creation at the start of a research project, through to publishing and sharing research at the end of the project, and archiving any research data for the long-term and future re-use once the project has ended.
The research data lifecycle involves data creation, data use, data publication and sharing, data archiving, and data re-use or destruction. However, data have a longer lifespan than the research project that creates them. In a Data Management Plan, you can structure how you will manage and share your research data.
Data Management Plan
A Data Management Plan (DMP), or Output Management Plan, is a document that describes how your research outputs will be generated, stored, used and shared within your project. A DMP is a living document, which can be updated throughout the research project as needed.
A Data Management Plan is a roadmap for you to manage your data efficiently and securely. This can prevent data loss or breaches. Planning ahead on how to manage your data consistently can save you time later on!
A Data Management Plan should provide information on five main topics
- Roles and Responsibilities for the management of the data and code to help prevent confusion/miscommunication later in the project. Please check the DMP recommendations and requirements library research support team of your institute and the website of your funder. You can check if your funder or institute has a DMP template using DMPonline.
- A list of types, standards and formats for data, documentation and metadata (discussed later) should allow team members to understand to comply with the recommendations from the start of the project.
- A distinction can be described in the plan separately for different data types such as raw (primary), processed and ready to use (finalised to publish) datasets.
- All types of data will have to be described to be placed into context by using metadata and adequate documentation which will allow anyone in your team to interpret the data in the future.
- Data storage and backup procedures should be assessed for each project and established depending on the institutional requirements, associated costs and recommended format from your field. We will diuscuss this in detail later in this lesson.
- Preservation of the research outputs can be managed differently based on if they can be made publicly available or not. Personal data or research outputs needed to apply for patents cannot be publicly shared but they still have to be preserved for several years, depending on the policies of your country, institute and funder. Learn more about this in detail in Sharing and Archiving Data chapter in The Turing Way.
- Reuse of your research outputs should be ensured by selecting licenses for different components of your research when you make your output available on a repository (see the Licensing subchapters on data and software for more information). A dedicated document (such as a README file) is recommended for describing research outputs into context. UK Data Service has provided a Data Management Checklist to help cover different aspects of the DMP.
The FAIR Principles
The FAIR guiding principles for scientific data management and stewardship are guidelines to improve the Findability, Accessibility, Interoperability and Reusability of digital assets; all of which support research reproducibility. The FAIR principles facilitate the availability of research data so that others can reuse data.
FAIR data should be:
- Findable: The first step in (re)using data is to find them! Descriptive metadata (information about the data such as keywords) are essential.
- Accessible: Once the user finds the data and software they need to know how to access it. Data could be openly available but it is also possible that authentication and authorisation procedures are necessary.
- Interoperable: Data needs to be integrated with other data and interoperate with applications or workflows.
- Reusable: Data should be well-described so that they can be used, combined, and extended in different settings.
Making data ‘FAIR’ is not the same as making it ‘open’. Accessible means that there is a procedure in place to access the data. Data should be as open as possible, and as closed as necessary. It is also important to say that the FAIR principles are aspirational: they do not strictly define how to achieve a state of FAIRness, but rather describe a continuum of features, attributes, and behaviours that will move a digital resource closer to that goal. Even though the FAIR principles have been defined to allow machines to find and use digital objects automatically, they improve the reusability of data by humans as well. The capacity of computational systems to find, access, interoperate, and reuse data, with minimal human intervention, is essential in today’s data-driven era.
You can find a more detailed overview of the FAIR principles by GO FAIR of what the FAIR principles recommend.
Summary of “FAIR - How To”
We have provided an additional lesson to discuss the How-Tos of FAIR principles in the context of data and software. See FAIR How-To for data and software for detail.
- Reference: E. L.-Gebali, S. (2022). BOSSConf_2022_Research_Data_Management. Zenodo. doi: 10.5281/zenodo.6490583
- Deposit your data where others can find it, keep in mind where your peers can find it, such as, field specific repository and give it a stable unique identifier (PID).
- Make your data & metadata accessible via standard means such as http/API.
- Create metadata and explain in detail what this data is about, never assume people know!
- Deposit metadata with PID and make it available with/out data i.e. in case data itself is heavily protected.
- Include information on ownership, provenance and citation.
- Outline what the reusers of your data are/not allowed to do, use clear license. Commonly used licenses like MIT or Creative Commons (keep in mind funders requirements).
- Specify access conditions, if authentication or authorization is required.
- Describe your data in a standardized fashion using agreed terminology and vocabulary.
- Share the data in preferred & open file formats.
- Start the process early on!
A Note on Personal or Sensitive Data
Personal data is information about living people who can be identified using the data that you are processing, either directly or indirectly. A person’s name, address or Social Security number, as well as, racial/ethnic identity, political opinions, religious/philosophical beliefs, trade union membership, genetic and biometric data, physical or mental health, and sexual orientation are some examples of personal data. Indirect identifiers include health, economic, cultural or social characteristics. Especially when a certain combination of these identifiers can be used to identify a person, care must be taken to manage the data properly.
There are various policies in place in different countries to protect the rights of individuals over their personal data. For instance, in the European Union and the UK the GDPR (General Data Protection Regulation) applies to the processing of personal data and may require researchers to carry out a Data Protection Impact Assessment (DPIA). Processing means doing anything with a person’s information, including collection, storage, analysis, sharing, deletion and destruction. Please review the national/institutional policies that apply to your research to ensure that you are up to date with the requirements of managing sensitive data. Please read Personal data management, informed consent, Research Ethics Committees Processes and Open Data sections in The Turing Way for further details.
Data Storage, Organisation and Backup Procedures
Data loss can be catastrophic for your research project and can happen often. You can prevent data loss by picking suitable storage solutions and backing your data up frequently.
- Most institutions will provide a network drive that you can use to store data.
- Portable storage media such as memory sticks (USB sticks) are more risky and vulnerable to loss and damage.
- Cloud storage provides a convenient way to store, backup and retrieve data. You should check terms of use before using them for your research data.
Especially if you are handling personal or sensitive data, you need to ensure the cloud option is compliant with any data protection rules the data is bound by. To add an extra layer of security, you should encrypt devices and files where needed. Your institution might provide local storage solutions and policies or guidelines restricting what you can use. Thus, we recommend you familiarise yourself with your local policies and recommendations.
Note
- Some concepts discussed in the previous chapter such as setting up project repository, version controlling, pre-registration, and licensing apply to this point.
- Also consider FAIR practices, data organisation and handling sensitive data practices, as well as metadata and documentation that are discussed below.
Spreadsheets, such as Microsoft Excel files, google sheets, and their Open Source alternative (for instance) LibreOffice, are commonly used by wet-lab experimentalists to collect, store, manipulate, analyse, and share research data. Spreadsheets are convenient and easy-to-use tools for organising information into an easy to write and easy to read forms for humans. However, one should use them with caution, as the use of an inappropriate spreadsheet is a major cause of mistakes in the data analysis workflow.
Please refer to the Data Carpentry Ecology Lesson and The Turing Way chapter for managing data in spreadsheet for best practices.
Backups
To avoid losing your data, you should follow good backup practices.
- You should have 2 or 3 copies of your files, stored on
- at least 2 different storage media,
- in different locations.
The more important the data and the more often the datasets change, the more frequently you should back them up. If your files take up a large amount of space and backing up all of them proves to be challenging or expensive, you may want to create a set of criteria for when you back up the data. This can be part of your data management plan (DMP).
When you are ready to release the data to the wider community, you can also search for the appropriate databases and repositories in FAIRsharing, according to your data type, and type of access to the data. Learn more about this in The Turing Way chapter on sharing and archiving Data.
Acknowledgement
- This episode is a reuse of The Turing Way chapter on Research Data Management.
- Among many authors, reviewers and contributors, we thanks Esther Plomp (Data Steward at TU Delft) for maintaining this chapter in The Turing Way Guide for Research Data Management.
- Please cite The Turing Way as: The Turing Way Community. (2021). The Turing Way: A handbook for reproducible, ethical and collaborative research (1.0.1). Zenodo. https://doi.org/10.5281/zenodo.5671094
Key Points
Good research data management practices esures findability of your research data.
Storing, regular backing-up and archiving prevents data loss.
Sharing all types of research data transparently makes them easier to understand and reuse by others.
Gives fair recognition to people generating, handling and using data, and further stimulates collaboration with others.
Version Control and Open Science Practices
Overview
Teaching: 10 min
Exercises: 0 minQuestions
How is version control system relevant for biomedical research?
How to maintain history of contributions and contributors?
How to apply open science practices to work transparently and collaborate openly?
Objectives
Describe the importance of version control systems
Nudge the use of GitHub/GitLab for open collaboration
Share open science practices for transparent and ethical research
Version Control, Open Science and Identifiers to Cite Research Objects
[Add a biological context or case study]
Maintaining History through Version Control

Version control allows tracking of history and go back to different versions as needed. The Turing Way project illustration by Scriberia for The Turing Way Community Shared under CC-BY 4.0 License. Zenodo. http://doi.org/10.5281/zenodo.3332807
Practices and recommendations described in this lesson are applicable to all areas of biological research. What can be considered slightly different in computational projects is that every object required to carry out the research exist in digital form. Starting from research workflow, data, software, analysis process, resulting outcomes as well as how researchers involved in the project communicate with each other. This means that research objects can be organised and maintained without losing the provenance or missing knowledge of how each of these objects is connected in the context of your project.
Versioning Every Research Object
Management of changes or revisions to any type of information made in a file or project is called versioning. Version Control Systems are platform and technical tools that allow all changes made in a file or research object over time is recorded. Version Control Systems, or VCS, allows all collaborators to track history, review any changes, give appropriate credit to all contributors, track and fix errors when they appear and revert or go back to earlier versions.
Different VCS can be used through a program with web browser-based applications (such as Google Docs for documents) and more dynamically for code and all kinds of data through command-line tools (such as Git) and their integration into the graphical user interface (Visual Studio Code editor, Git-gui and gitkraken). The practice of versioning is particularly important to allow non-linear or branched development of different parts of the project, testing a new feature, debugging and error or reusing code from one project to different data by different contributors.
GitLab, GitHub, or BitBucket are online platforms that allow version-controlled projects online and allow multiple collaborators to participate. Different members can download a copy of the online repository (most recent version), make changes by adding their contributions locally on their computer and push the changes to GitLab/GitHub/BitBucket (a new version!) allowing others to build on the new development.
Read All you need to know about Git, GitHub & GitLab on Towards Data Science and version control in The Turing way for more details on workflow, technical details of using git and versioning large datasets.
Apply Open Science Best Practices
Open Science invites all researchers to share their work, data and research components openly so that others can read, reuse, reproduce, build upon and share them. Particularly in computational research and software development projects, open source practices are widely promoted. Unfortunately, making research components open doesn’t always mean that they can be easily discovered by everyone, can be reproduced and built upon by others or everyone will know how to use them. Applying open and inclusive principles to open science and reproducible research requires time, intention, resources and collaboration, which can be overwhelming for many (see Ten arguments against Open Science that you can win). However, by normalising the use of research best practices on a day-to-day basis, you can ensure that everyone has a chance to build habits around opening their work for others in the team, asking for regular feedback, getting attributed for their work and enjoying the process of collaboration.
Open doesn’t mean sharing everything, but making it ‘as open as possible and as closed as necessary’. Your research can still be reproducible without all parts necessarily being open. Research projects that use sensitive data should be more careful and follow research data management plans closely (discussed in the next chapter).
Important Reasons for Practicing Openness
Open Science in Research
- Maintains transparency
- Allows others to attribute your work fairly
- Stops others from reinventing the wheel
- Invites collaborators from all around the world
- Makes your work easy to release to be cited by others

Open versus Closed Research. The Turing Way project illustration by Scriberia for The Turing Way Community Shared under CC-BY 4.0 License. Zenodo. http://doi.org/10.5281/zenodo.3332807
- When a project is designed in an open repository, it allows all stakeholders to track the progress, raise errors and collaborate to improve the project.
- When developed openly, such as on GitLab or through the registered report, it is easy to point to the timeline when an idea or experiment was proposed and exhibit how the project developed, who contributed and how others can attribute the work.
- Having your research open from the start can help others working in similar subjects or starting research. It allows them to conduct their review work effectively and build on the existing work, rather than starting from scratch, or ‘reinventing the wheel’.
- With open repositories and descriptions for where you need help or how others can collaborate, you can get people in your area with complementing skills and new ideas interested in your work, even when you don’t know them.
Research Objects can be Released with Digital Object Identifiers (DOI)
DOIs are alphanumerical unique and persistent identifiers with a permanent web address for different research objects that can be cited by you and other researchers. Each pre-print and publication is published with a DOI, but independent of the paper, different research objects can be published online on servers that offer DOIs at any stage of your research. Some of these servers are Zenodo, FigShare, Data Dryad (for data), Open Grants (for grant proposals) and Open Science Framework (OSF) (for different components of an open research project). It allows you to show connections between different parts of research as well as cite different objects from your work independently.
When working on GitHub for instance, you can connect the project repository with Zenodo to get a DOI for your repository. The Citation File Format, then lets you provide citation metadata, for software or datasets, in plaintext files that are easy to read by both humans and machines. Read the Making Research Objects Citable chapter in The Turing Way Guide to Communication.
Every Little Step Counts towards Openness
Open Science can mean different things in different contexts: open data, open source code, open access publication, open scholarship, open hardware, open education, open notebook, citizen science and inclusive research. Expert open science practitioners might consider applying a combination of open science practices and make decisions in their work to maintain different kinds of openness. However, for the new starters in your team, open science can be as simple as ensuring that:
- everyone has added an appropriate license to their project repository,
- recorded their work and shared their project’s roadmap on a README/landing page,
- provided some basic manual for how to use their work and how to contribute,
- given credit to previous work upon which they build, and
- regularly communicate about their research.

Small steps towards open science. The Turing Way project illustration by Scriberia for The Turing Way Community Shared under CC-BY 4.0 License. Zenodo. http://doi.org/10.5281/zenodo.3332807
Encourage taking small steps towards openness as a responsibility towards research integrity in your team. There are many community-driven resources, guidance and opportunities in open science that provided structured support to learn about open science. For instance, The Turing Way chapter on Open Research and FOSTER Open Science provides an introduction to help researchers understand what open science is and why it is something you should care about. Another hands-on opportunity is provided by Open Life Science, which is a 16-week long training and mentoring for anyone in research interested in going through the programme to apply open science practices systematically in their research projects.
Conclusion
[What gaps have we filled in this section - add biological context]
Resources and References for Technical Details
- The Turing Way. The Turing Way Community. (2021). The Turing Way: A handbook for reproducible, ethical and collaborative research (1.0.1). Zenodo. DOI: 10.5281/zenodo.5671094
- What is a Registered Report? by JMIR, referencing to Registered Reports by Center for Open Science.
- Open Life Science training and Mentoring Programme. Batut, Bérénice, Yehudi, Yo, Sharan, Malvika, Tsang, Emmy, & Open Life Science Community. (2021). Open Life Science - Training and Mentoring programme - Website release 2019-2021 (1.0.0). Zenodo. DOI: 10.5281/zenodo.5636584
Key Points
Version controlled repository help record different contributions and contributor information openly.
Open Science is an umbrella term that involve different practices for research in the context of different research objects.
Online Persistent Identifiers or Digital Object Identifiers are useful for releasing and citing different versions of research objects.
Method selection
Overview
Teaching: 0 min
Exercises: 0 minQuestions
How can I build on existing work?
What resources/infrastructure should I consider?
Is machine learning suitable for my project?
Objectives
First learning objective. (FIXME)
Building on existing knowledge
With existing code bases, downloading and using tools that exist on github is more and more valuable in the scientific community.
- What previous projects exist in this institute
- What do we know already from the broader community
- What is the added value of the project in hand
Is ML and AI suitable for my project?
(((Work on this with Fede in preparation for the AI presentation)))
- How to assess if ML and AI applies to my work
Resource requirement (storage, hosting and archiving)
- What is available in the organisation
- What services/resources we need from outside (RSE, HPC, Cloud infra, DSH)
- Technical training for people working on the project
Conclusion
- What gaps have we filled in this section
- Project management overview
- Reproducible environment
Resources for taking this to next level
- https://the-turing-way.netlify.app/collaboration/new-community.html
Key Points
First key point. Brief Answer to questions. (FIXME)
Data analysis and results
Overview
Teaching: 20 min
Exercises: 0 minQuestions
What is the role of data wrangling?
What are good practices for keeping code in check?
How to use data visualisation for insight and communication?
Objectives
First learning objective. (FIXME)
To make informed decisions using data.
Data Wrangling and Cleaning
Data wrangling involves cleaning data so it can be easily read and analysed by machines. It can also involve integration, extraction, removing missing points, and anything that makes data useable and functional. Regardless of the methods, the code involved with data cleaning steps should be carefully documented so that the steps involved can be repeated from raw data to cleaned data.
When working with data sets,
ggplot(in R) ormatplotlib/seaborn(in Python) libraries provide attractive figures that can be produced very quickly. Visualising data should not not wait for the point of publication, and can be used to explore data from the start, and also illustrate methodology. This is particularly valuable in Jupyter Notebooks. Code to produce figures should be literate, functional, reuseable in the same way as data cleaning and analysis code. That way future visualisations can be easily updated or reused.
Data wrangling
Definition
Data wrangling—also called data cleaning, data remediation, or data munging—refers to a variety of processes designed to transform raw data into more readily used formats. The exact methods differ from project to project depending on the data you’re leveraging and the goal you’re trying to achieve.
Some examples of data wrangling include:
- Merging multiple data sources into a single dataset for analysis,
- Identifying gaps in data (for example, empty cells in a spreadsheet) and either filling or deleting them,
- Deleting data that’s either unnecessary or irrelevant to the project you’re working on,
- Identifying extreme outliers in data and either explaining the discrepancies or removing them so that analysis can take place.
Data wrangling can be a manual or automated process. In scenarios where datasets are exceptionally large, automated data cleaning becomes a necessity.
Data Wrangling steps
Each data project requires a unique approach to ensure its final dataset is reliable and accessible. That being said, several processes typically inform the approach. These are commonly referred to as data wrangling steps or activities.
Discovery
Discovery refers to the process of familiarizing yourself with data so you can conceptualize how you might use it. You can liken it to looking in your refrigerator before cooking a meal to see what ingredients you have at your disposal.
During discovery, you may identify trends or patterns in the data, along with obvious issues, such as missing or incomplete values that need to be addressed. This is an important step, as it will inform every activity that comes afterward.
Structuring
Raw data is typically unusable in its raw state because it’s either incomplete or misformatted for its intended application. Data structuring is the process of taking raw data and transforming it to be more readily leveraged. The form your data takes will depend on the analytical model you use to interpret it.
Cleaning
Data cleaning is the process of removing inherent errors in data that might distort your analysis or render it less valuable. Cleaning can come in different forms, including deleting empty cells or rows, removing outliers, and standardizing inputs. The goal of data cleaning is to ensure there are no errors (or as few as possible) that could influence your final analysis.
Enriching
Once you understand your existing data and have transformed it into a more usable state, you must determine whether you have all of the data necessary for the project at hand. If not, you may choose to enrich or augment your data by incorporating values from other datasets. For this reason, it’s important to understand what other data is available for use.
If you decide that enrichment is necessary, you need to repeat the steps above for any new data.
Validating
Data validation refers to the process of verifying that your data is both consistent and of a high enough quality. During validation, you may discover issues you need to resolve or conclude that your data is ready to be analyzed. Validation is typically achieved through various automated processes and requires programming.
Publishing
Once your data has been validated, you can publish it. This involves making it available to others within your organization for analysis. The format you use to share the information—such as a written report or electronic file—will depend on your data and the organization’s goals.
Importance of Data Wrangling
Any analyses you perform will ultimately be constrained by the data that informs you. If data is incomplete, unreliable, or faulty, then analyses will be too—diminishing the value of any insights gleaned.
Data wrangling seeks to remove that risk by ensuring data is in a reliable state before it’s analyzed and leveraged. This makes it a critical part of the analytical process.
It’s important to note that data wrangling can be time-consuming and taxing on resources, particularly when done manually. This is why many organizations institute policies and best practices that help employees streamline the data cleanup process—for example, requiring that data include certain information or be in a specific format before it’s uploaded to a database.
For this reason, it’s vital to understand the steps of the data wrangling process and the negative outcomes associated with incorrect or faulty data.
Code that cleans and processes data (processing code) provides the very beginning of the data analysis pipeline: starting with raw data and resulting in processed data.

Cleaning data means it can be easily read and analysed by machines and used in analysis pipelines. It can involve changing labels, subsetting, integration, extraction, removing missing points, and anything that makes data useable and functional. Regardless of the methods, the code involved in data cleaning steps should be carefully documented so that the steps involved can be repeated from raw data to clean data. When reviewing this type of code, consider whether the steps involved are readable and in the correct order.
Case study example:
A PhD student has recorded lab results in an Excel spreadsheet. She has a copy of the raw results, but for her analysis, she wants to remove some outliers. She manually deletes some rows and saves the data as .csv. There is no record of what she deleted or the rule she applied, and a manual check of the differences between her data and the original would be necessary.
Instead, another PhD student writes an R script that reads the raw data file, uses a filter where the method and parameters are saved, and saves the output as a CSV file. Her process for removing outliers is reproducible.
Within a computational project, these steps may accidentally become obscure and so specific effort is required to make sure no one is manually processing data in a way that can’t be repeated and that all the steps are recorded.
genomeProject/processing/data_cleaning.py

import pandas as `pd`

# Reads raw data from a directory.
df = pd.read_csv('genomeProject/data/220103_GenomicData.csv')

# Shows the first 5 rows of the data set.
df.head(5)

# Remove unwanted columns by name
df.drop(columns=['year','quasi_column_ID'],inplace=True)

# Rename a column name
df.rename(columns={"batch_3_4_7": "batch_347"})

# Shows the first 5 rows of the data set now with the columns renamed and some removed
df.head(5)

# Change the index of the data to an ID
df = df.set_index('ID')

# Save processed data set
df.to_csv(genomeProject/data/220103_GenomicData_processed)
Data exploration and insights
The first part of data analysis is exploration. It is usually helpful to look at the data directly, and this might involve:
- Printing rows of a dataset in a notebook/IDE
- Printing the summary statistics for each row of a column
- Producing a scatter plot or histogram for a column of data
Visualising processed data before any analysis is usually always helpful.
When working with data sets, ggplot (in R) or matplotlib/seaborn (in Python) libraries provide attractive figures that can be produced very quickly. Visualising data is useful for exploring data from the start, and also illustrates the methodology or the steps of analysis.
This is particularly valuable in Jupyter Notebooks. Code to produce figures should be literate, functional, and reusable in the same way as data cleaning and analysis code.
That way future visualisations can be easily updated or reused.
Unlike data visualisations for release/communicating results/publications, these figures may be more practical than aesthetic. It is perfectly acceptable to open 25 histograms at once when exploring data, even though in an eventual paper you would only show one. Data visualisation is a tool, and small functions or scripts can make sure exploring data is practical and easy to repeat.
The code to produce the following figure is below.
Libraries like matplotlib do a lot of the hard work for you, and there are countless tutorials for different kinds of visualisations.

plt.hexbin(x, y, gridsize=30, cmap='Blues')
cb = plt.colorbar(label='count in bin')
Data Analysis and Statistics
(Need to discuss this further, what is patronising?)
With readable, clean, processed data that you have explored using figures, the next stage of the data pipeline is analysis. There may be many variables that are related directly or indirectly to the objective. For that, we first need to study about all the variables whether it is nominal or ordinal. Preparing the data for analysis is done after understanding the data. While understanding we get to know about missing in the data, finding the independent and dependent variables, etc.
Depending on your computational project, this may involve elaborate and complex analyses, modelling, simulation, and even machine learning. However, even if this step is just running a single statistics test, keeping the code modular in clearly defined steps is key.
Here is an example of applying a Butterworth filter to some data in Python. The specifics don’t matter, you can consider this code pseudocode for any kind of analysis step.
genomeProject/analysis/01_butterworth_filter.py


import numpy as np
from scipy.signal import butter,filtfilt

# (A) Read processed data from file
df = pd.read_csv('genomeProject/data/220103_GenomicData_processed.csv')

# (B) Defining filter parameters
T = 5.0         # Sample Period
fs = 30.0       # sample rate, Hz
cutoff = 2      # desired cutoff frequency of the filter, Hz
nyq = 0.5 * fs  # Nyquist Frequency
order = 2       # quadratic
n = int(T * fs) # total number of samples

# (C) Define the Butterworth Filter Function
def butter_lowpass_filter(data, cutoff, fs, order):
    normal_cutoff = cutoff / nyq

    # Get the filter coefficients
    b, a = butter(order, normal_cutoff, btype='low', analog=False)
    filtered_data = filtfilt(b, a, data)

    return filtered_data

# (D) Apply Butterworth Filter Function to the data
filtered_data = butter_lowpass_filter(data, cutoff, fs, order)
(A) the processed data is read into the script. Next, (B) the fixed parameters are set and named with comments.
These fixed numbers are saved as variables with names. In (C) the filter itself is written as a Python Function, which means it can be called multiple times throughout the script.
Because the parameters are not written into the function directly (so it doesn’t say b, a = butter(2, 15,btype='low', analog=False) but instead uses variables) this code is reusable without having to paste and edit the numbers every time you apply a function.
You can also call this function in other scripts. It can make sense to produce a file with the functions inside that can be imported into different scripts in case other projects also have similar methods. This is known as a package or library. This means altering a function doesn’t mean searching across every file on every project and changing it dozens of times.
Case Study
A postdoc wrote a helpful series of functions for data analysis with neurophysiology recordings. The postdoc wrote them as reuseable, and so two PhD students copied and pasted these blocks of code into their code and used it to analyse the data for their projects.
The postdoc later discovers a better way of writing the functions. One PhD student also wants to change the method and so has to search through his files to replace the code. The other PhD student wants the old method in some files and the new method in others, and so does not change all of them. It is therefore complex to follow the differences in the methods across the projects, and this is very open to errors in typos.
Instead, the postdoc could have saved his functions in the lab’s private repo which becomes the master copy and students pull from this. With the functions saved in a library, the PhD students can import them into their scripts. Now when the postdoc changes the functions and saves them to the repo, PhD students can choose to update their version of the functions. The students should document which version they have used.
The output of the analysis code may be statistics results that are reported in a paper, and therefore the steps required to reproduce them are critically important.
Figures for Communicating Results
With the analysis complete, data visualisation is usually used to communicate results. The code used to produce figures is the next step in the data pipeline.
For publications or posters, well-constructed figures improve science communication and help improve the impact of your research. Being able to produce multipanel figures with annotations and different colour schemes is complex but one of the advantages of learning a data science language.
It is therefore worth taking the time for researchers to learn the technical skills in R, Python, or another language to produce visualisations. Producing figures in Excel is limiting and often frustrating, particularly as there are only limited options in layout and type of figure.

Exploring constraints on a wetland methane emission ensemble (WetCHARTs) using GOSAT observations, Parker et al 2020
https://doi.org/10.5194/bg-17-5669-2020

Spatial transcriptome profiling by MERFISH reveals subcellular RNA compartmentalization and cell cycle-dependent gene expression, Xia et al 2019 https://www.pnas.org/doi/10.1073/pnas.1912459116
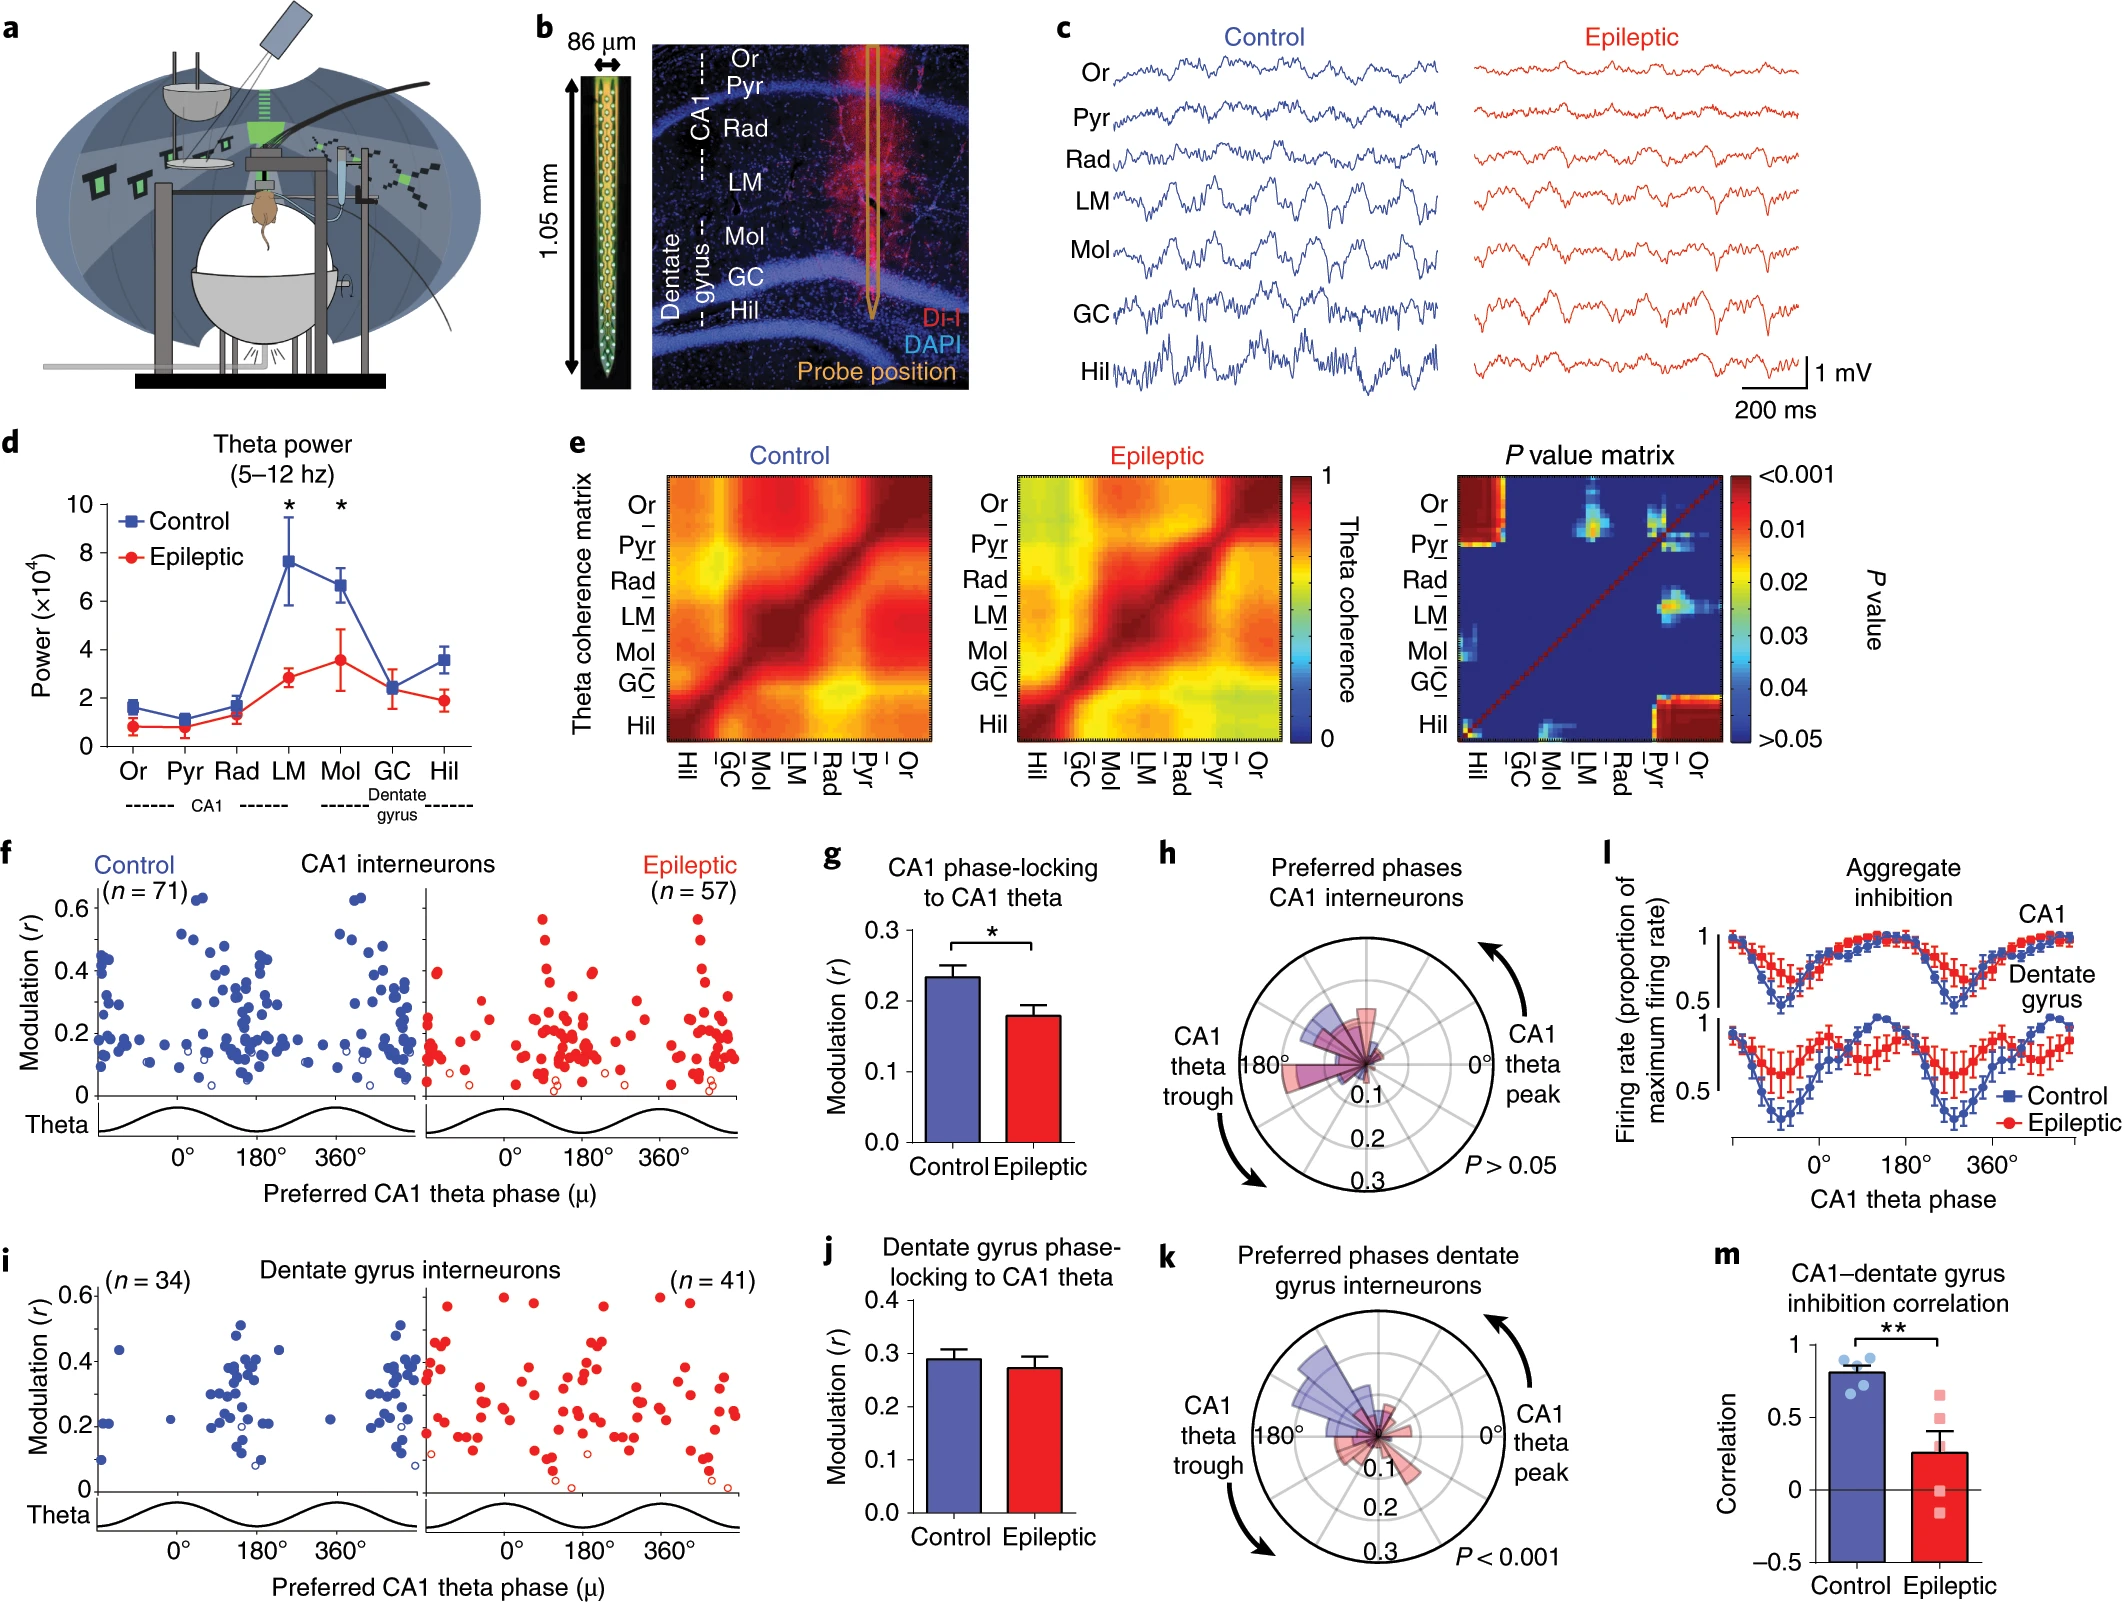
These figures are more than just visualising data, they’re about communication and require adjusting the styles and formats within ggplot or matplotlib or other libraries.
As before, any code used to produce visualisations should be reproducible and literature. Often in peer review figures need to be adjusted or altered, and having the code to do so makes the process much simpler.
It is usually cleaner to keep data visualisation code separate from analysis, just to keep a code base organised and modular.
Accessibility
- For simple figures, using shaded vs unshaded and single colour is best when considering publications may be printed in black and white
- Colours should be colourblind friendly, resources are available for this.
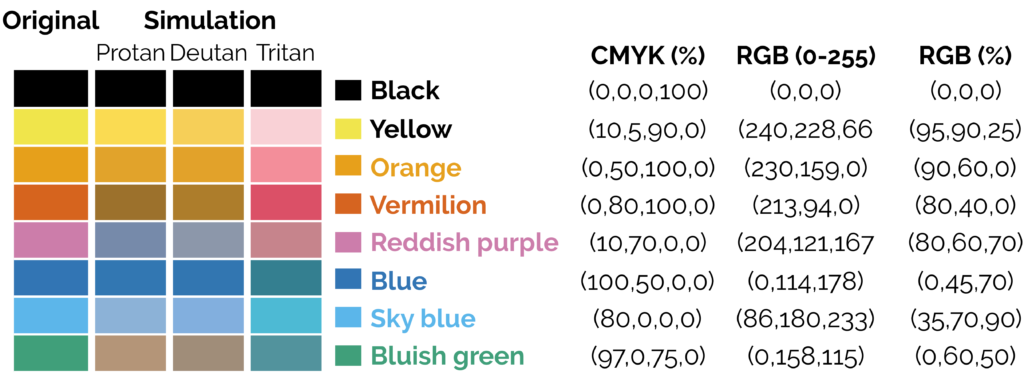
- If using a colour map, avoid the standard rainbow. Other rainbows like viridis colour maps can be downloaded. The brightness varies across the rainbow which leads to visual artefacts that do not exist:

The transition between greens to yellow and red are more prominent than the transitions between greens and blues, making stark boundaries that do not exist. A rainbow with equal brightness solves the problem.
Sisneros et al (2016) Chasing Rainbows: A Color-Theoretic Framework for Improving and Preserving Bad Colormaps. https://doi.org/10.1007/978-3-319-50835-1_36
-
Keeping readability in mind with text size/font and similar considerations
-
“First key point. Brief Answer to questions. (FIXME)”
Data exploration and insights
Let us now create two different DataFrames and perform the merging operations on it.
# import the pandas library
import pandas as pd
left = pd.DataFrame({
         'id':[1,2,3,4,5],
         'Name': ['Alnus', 'Agrostis', 'Betula', 'Vaccinium', 'Dactylis'],
         'subject_id':['sub1','sub2','sub4','sub6','sub5']})
right = pd.DataFrame(
         {'id':[1,2,3,4,5],
         'Name': ['Calune', 'Fallopia', 'Stachys', 'Stellaria', 'tiphy'],
         'subject_id':['sub2','sub4','sub3','sub6','sub5']})
print left
print right
- Data Visualisation as a tool
- Reference: https://helenajambor.wordpress.com/2022/01/04/science-visualization-trends-of-2021/
Statistical analysis
Selection of appropriate statistical method is very important step in analysis of data. A wrong selection of the statistical method not only creates some serious problem during the interpretation of the findings but also affects the conclusion of the study. In statistics, for each specific situation, statistical methods are available to analysis and interpretation of the data. To select the appropriate statistical method, one need to know the assumption and conditions of the statistical methods, so that proper statistical method can be selected for data analysis. Other than knowledge of the statistical methods, another very important aspect is nature and type of the data collected and objective of the study because as per objective, corresponding statistical methods are selected which are suitable on given data. Incorrect statistical methods can be seen in many conditions like use of unpaired t-test on paired data or use of parametric test for the data which does not follow the normal distribution, etc., Two main statistical methods are used in data analysis: descriptive statistics, which summarizes data using indexes such as mean, median, standard deviation and another is inferential statistics, which draws conclusions from data using statistical tests such as student’s t-test, ANOVA test, etc.[
Type and distribution of data used
For the nominal, ordinal, discrete data, we use nonparametric methods while for continuous data, parametric methods as well as nonparametric methods are used. For example, in the regression analysis, when our outcome variable is categorical, logistic regression while for the continuous variable, linear regression model is used (https://www.ncbi.nlm.nih.gov/pmc/articles/PMC6206790/).
The choice of the most appropriate representative measure for continuous variable is dependent on how the values are distributed. If continuous variable follows normal distribution, mean is the representative measure while for non-normal data, median is considered as the most appropriate representative measure of the data set.
Similarly in the categorical data, proportion (percentage) while for the ranking/ordinal data, mean ranks are our representative measure. In the inferential statistics, hypothesis is constructed using these measures and further in the hypothesis testing, these measures are used to compare between/among the groups to calculate significance level.
Case Study:
A Researcher wants to compare the diastolic blood pressure (DBP) between three age groups (years) (<30, 30–50, >50). If the DBP variable is normally distributed, > mean value is the representative measure and null hypothesis stated that mean DBP values of the three age groups are statistically equal. In case of non-normal DBP variable, median value is the representative measure and null hypothesis stated that distribution of the DBP values among three age groups are statistically equal. In above example, one-way ANOVA test is used to compare the means when DBP follows normal distribution while Kruskal–Wallis H tests/median tests are used to compare > the distribution of DBP among three age groups when DBP follows non-normal distribution.
Similarly, suppose he wants to compare the mean arterial pressure (MAP) between treatment and control groups, if the MAP variable follows normal distribution, independent samples t-test while in case follow non-normal distribution, Mann–Whitney U test are used to compare the MAP between the treatment and control groups.
Other Statistical methods
- Logistic regression analysis is used to predict the categorical outcome variable using independent variable(s).
- Survival analysis is used to calculate the survival time/survival probability, comparison of the survival time between groups as well as to identify the predictors of the survival time of the subjects (Cox regression analysis).
- Receiver operating characteristics (ROC) curve is used to calculate area under curve (AUC) and cutoff values for given continuous variable with corresponding diagnostic accuracy using categorical outcome variable.
- Diagnostic accuracy of the test method is calculated as compared with another method (usually as compared with gold standard method).
- Sensitivity (proportion of the detected disease cases from the actual disease cases), specificity (proportion of the detected non-disease subjects from the actual non-disease subjects), overall accuracy (proportion of agreement between test and gold standard methods to correctly detect the disease and non-disease subjects) are the key measures used to assess the diagnostic accuracy of the test method.
- Other measures like false negative rate (1-sensitivity), false-positive rate (1-specificity), likelihood ratio positive (sensitivity/false-positive rate), likelihood ratio negative (false-negative rate/Specificity), positive predictive value (proportion of correctly detected disease cases by the test variable out of total detected disease cases by the itself), and negative predictive value (proportion of correctly detected non-disease subjects by test variable out of total non-disease subjects detected by the itself) are also used to calculate the diagnostic accuracy of the test method.
Summary of these methods can be found here https://www.ncbi.nlm.nih.gov/pmc/articles/PMC6639881/table/T3/?report=objectonly
Communicating Results
- What elements are involved
Producing figures
- Best practices
- Versions
- Publication with persistent identifier
Conclusion
- What gaps have we filled in this section
- Project management overview
Resources for taking this to next level
- https://the-turing-way.netlify.app/collaboration/new-community.html
- Data Visualisation as a tool
- Reference: https://helenajambor.wordpress.com/2022/01/04/science-visualization-trends-of-2021/
Key Points
First key point. Brief Answers to questions. (FIXME)
Implementing tools and methods
Overview
Teaching: 20 min
Exercises: 0 minQuestions
How to manage and oversee tasks and track progress of your projects on GitHub?
How collaborative practices help ensure code quality, testing and reuse?
What is literate programming and how does it help with early communication, testing and collaboration?
Objectives
Demonstrate GitHub Project Board to enable project management.
Discuss the importance of code quality, modular programming, and code testing for reusable error-free code.
Encourage researchers to combine code with documentation to communicate their work.
Learn about methods to capture reproducible research environments.
Project Management Tools
In the previous chapters, we have already discussed practices that enable the effective management of projects in:
- setting up shared resources;
- defining the vision, mission and roadmap of your project;
- managing data and other research-related resources; and
- versioning and tracking progress.
It is important to communicate tasks and responsibilities to different stakeholders of the project. However, what is even more important is to allow all members to understand where in the entire project their tasks fit and how they can track the progress of the entire project. Project management tools such as Kanban provide a visual overview of the tasks, their status (to do, in progress, done) and the people responsible for them. These tasks can be visualised on a digital board where different columns can present different statuses, different task groups or priorities.
Some tools that are popular among research community is Asana, Trello, Todoist and Notion.
For computational projects, researchers already use online repositories on Github/GitLab to store and version control their projects. They can use several advanced features on these platforms for project management.
GitHub for Project Management
Issue is a GitHub integrated feature that allows everyone to track the progress on GitHub. Similar to a ‘To-Do List’, issues can be anything from a project milestone (releasing an R package, submitting to an online data repository, a working simulation) but also specific issues with code (fixing a bug, adding a function, updating tests).
Based on the tasks described in an issue, your collaborators can address them and save or ‘commit’ changes in their local copy of the repository. Local changes then can be ‘pushed’ to the repository on GitHub for ‘review’ via the Pull Request feature. Once a pull request is opened, different collaborators can discuss and review the potential changes and add follow-up commits before those changes are ‘merged’ into the main repository.
Project boards are kanban-like features on GitHub that help you visualise (list of tasks), categorise (in columns) and prioritise (drag/move around) different tasks. A collection of project boards can be created for a different set of tasks, comprehensive roadmaps, or even release checklists. By linking issues and Pull Requests, project boards can create workflows. The Project board shows metadata for issues and pull requests, like labels, assignees, the status, and who opened it. Additional notes within columns can be added as task reminders, references to issues and pull requests from any repository on GitHub.com, or to add information related to the project board. This Kanban board feature can be very helpful in getting a snapshot of multiple research projects within a team/lab and tracking what multiple people are currently working on. You can read more about Project Board in GitHub Documentation.
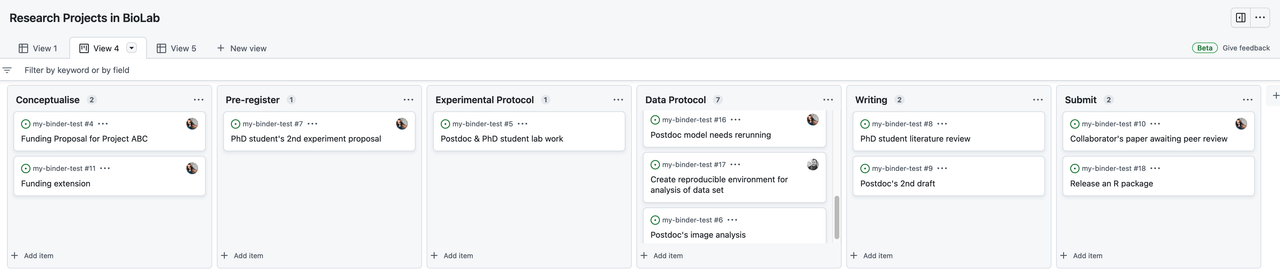
An example is Kanban for researcher project management. GitHub boards can be given any name.
Tutorial: Kanban Boards for Project Management (Click to view)
Within Github, the Projects Tab can provide a board with cards to organise issues collaboratively. If a team is already working within Github, this can be beneficial as everything remains in the same place. “Issues” can be used as a record of ToDos or others flagging up bugs and features that need to be addressed. They can be attached to particular repos and assigned to people.
A traditional Kanban for a collaborative computational project. Keeping track of bugs and what everyone is working on.
The Kanban board can be modified to whatever layout or structure makes sense to you. This example uses the concept to publication/release pipeline.
Github also allows different summary views for collaborative issues across multiple repos, which can be helpful for organising larger teams.
Author: Lydia France (Junior Data Scientist, The Alan Turing Institute, UK)
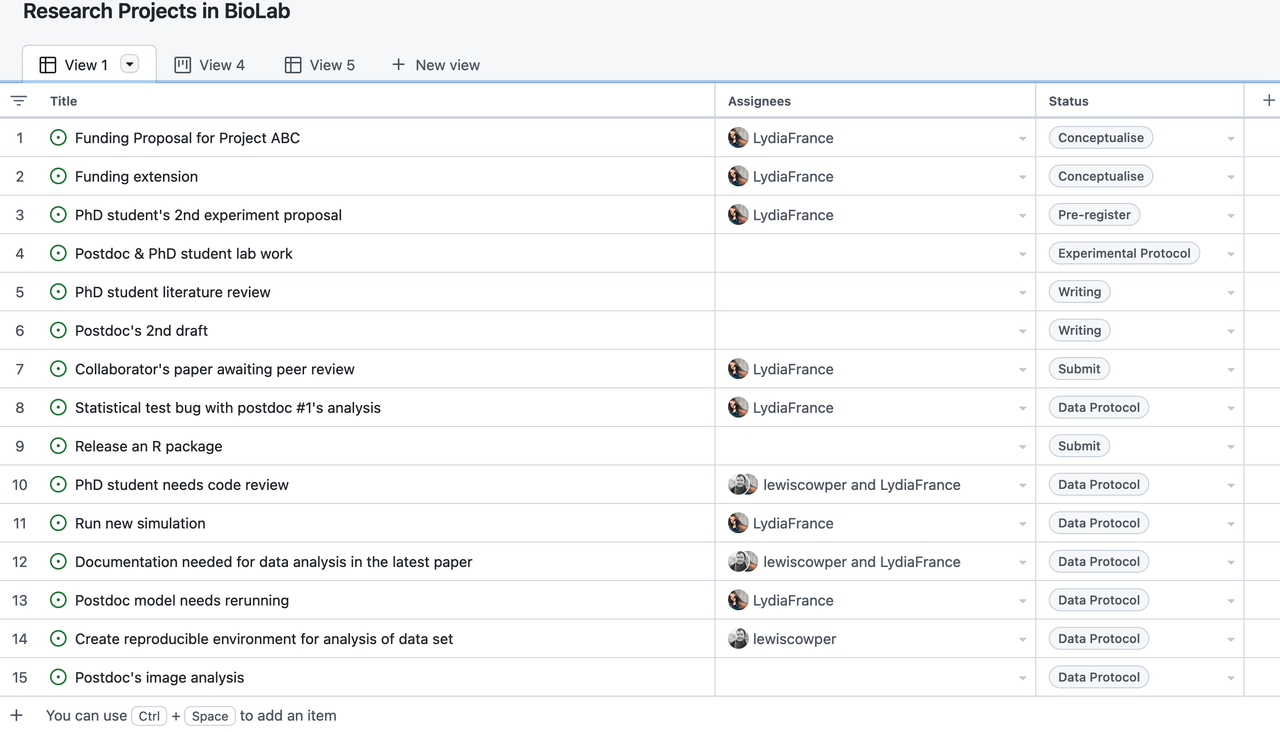
Collaborating on Computational Projects
Much research is now collaborative and a shared code repository can be effectively used to enable collaboration at all stages of code development at the analysis and implementation stage. Below we discuss selected research practices that allow collaboration while achieving computational reproducibility.
Code Quality
Writing code often comes down to decisions about when to save time. Code fast, and you have a solution within hours or days. Coding well requires an early investment that might be ignored in favour of “I’ll just find a quick solution…” But more often than not the time penalty is magnified as a result further down the line:
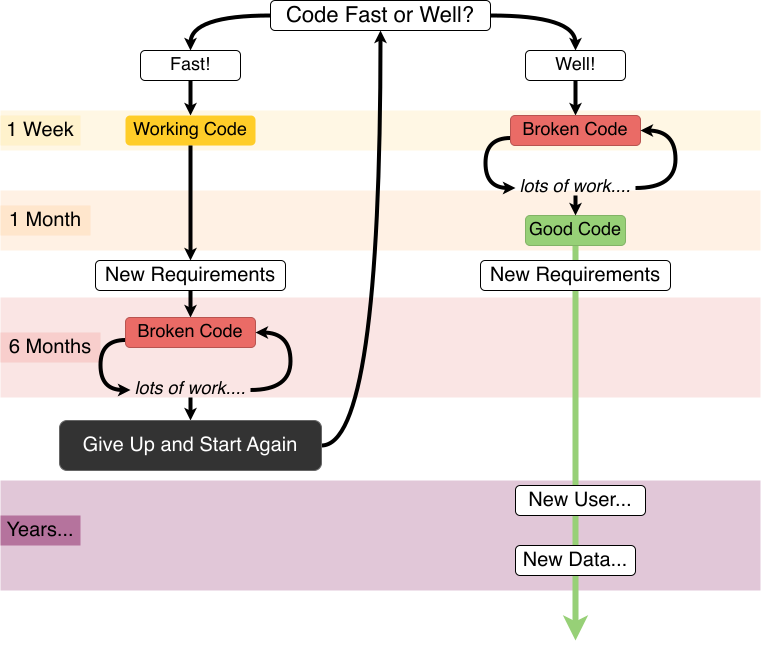
Adapted from the more pessimistic comic by XKCD
Writing good code early means losing days to deliberate good practice. But trying to undo mistakes and work with “good enough” code can take weeks or months, and still end up having to start again anyway. The blow to morale can also not be understated. “Good enough” fast code tends to have mistakes and is hard for others to review, which is not good for scientific pipelines. Even if you end up with workable code, it is not suitable for release or publication at the end of the project.
There are several ways to improve code quality that require relatively little effort. By following a coding style, code will be easier for the code developer and you (and others) to understand, even when you may not develop code yourself.
A coding style is a set of conventions on how to format code. For instance, what do you call your variables? Do you use spaces or tabs for indentation? Where do you put comments describing what the code chunk does? Consistently using the same style throughout, code becomes easier to read, understand and collaborate on even for non-coding contributors.
Opportunities where all members of a team have the chance to share examples from their work
- Cases where they found tricky bugs in their code and the process of debugging (reading error messages, tracking the bug, fixing it!)
- Project where they applied maths and statistics approaches using existing packages
- Creative visualisation of data that provides useful insights
- Tools and methods that improved their efficiency
- Code review and testing methods they learned about
These are where these time investments happen and help your students avoid the soul-destroying process of working with inefficient code and having to start from scratch. Good code is not about perfection, it is about general principles your students and postdocs can get training in. For more details, please read the Code Quality chapter in The Turing Way.
Modular Programming (Functions)
My postdoc wants to work with messy genomics data. I know my previous postdoc had to do the same thing and it took her months…. but it’s difficult to read her files so my new postdoc will have to work it out again.
Applying methods from one person’s work and applying it to another problem can take weeks, if not months, of work. Applying methods from publications is even harder: static PDF files can’t describe the lines of code and data that lead to those discoveries. This is an increasingly important problem in the face of growing mistrust in science, and a reproducibility crisis plaguing the sciences.
Instead, functional programming is about writing code that works as modular steps. Each step is clearly commented on and carefully produced so that it can be reused in different contexts. Often when you are analysing data, you need to repeat the same task many times. For example, you might have several files that all need loading and clean in the same way, or you might need to perform the same analysis for multiple species or parameters. Rather than copying and pasting, writing a function and calling that function leads to fewer errors and confusion overall.
We can think of this on a broad scale, say one student’s computational work has the following steps, where blue shows data cleaning, and yellow the analysis and statistics.

Another student can take reuse the data cleaning and initial visualisation steps because her data was from the same source and is in the same format. She can later add her own model:

On the micro-scale, functional programming ensures that each code file itself is comprised of modular blocks, whether for data processing, analysis pipeline, simulation and so on. Depending on your programming language, these may be used as a package or a library or saved in files that are available for installation. Just the same as the diagram above, making sure functions are robust and reuseable means they can be shared throughout different workflows and for different projects.
Training in functional programming is usually an excellent pre-requisite for members of your lab.
A first step can be to draw out and create diagrams to plan code before starting and identifying the modular steps involved. This does not require technical knowledge of a language and is, therefore, a great exercise for direct supervision. You can find practical details on reproducible code in the Guides to Better Science by British Ecological Society.
Code Testing
You should not skip writing tests because you are short on time, you should write tests because you are short on time.
 The Turing Way project illustration by Scriberia. Used under a CC-BY 4.0 licence. DOI: 10.5281/zenodo.3332807.
It is very, very easy to make mistakes when coding. A single wrong use of a character can cause a program’s output to be entirely wrong. Missing one data point, writing plus instead of minus symbol or using feet instead of meters might be a genuine human mistake, but in research, the results can be catastrophic. Careers can be damaged/ended, vast sums of research funds can be wasted, and valuable time may be lost exploring incorrect avenues. This is why code testing is vital.
Testing is a learned skill that needs to become a part of working on/improving a project. After changing their code, researchers should always check that their changes or fixes have not broken anything. There are several different kinds of testing and each has best practices specific to them.
A few important testing types
- Smoke testing: Very brief initial checks that ensure the basic requirements required to run the project hold. If these fail there is no point in proceeding to additional levels of testing until they are fixed.
- Unit testing: A level of the software testing process where individual units of a software are tested. The purpose is to validate that each unit of the software performs as designed.
- Integration testing: A level of software testing where individual units are combined and tested as a group. The purpose of this level of testing is to expose faults in the interaction between integrated units.
- System testing: A level of the software testing process where a complete, integrated system is tested. The purpose of this test is to evaluate whether the system as a whole gives the correct outputs for given inputs.
No matter the type of testing you use, general guidance is to start by writing any test and make a habit of running tests often.
- Make improvements where you can, and do your best to include tests with new code you write even if it’s not feasible to write tests for all the code that’s already written.
- Make the cases you test as realistic as possible. If for example, you have dummy data to run tests on you should make sure that data is as similar as possible to the actual data. If your actual data is messy with a lot of null values, so should your test dataset be.
There are tools available to make writing and running tests easier, these are known as testing frameworks. Find one you like, learn about the features it offers, and make use of them.
Writing tests typically encourage researchers to write cleaner, more modular code as such code is far easier to write tests for, leading to an improvement in code quality. As well as advantaging individual researchers testing also benefits research as a whole. It makes research more reproducible by answering the question “how do we even know this code works”. To gain an in-depth understanding of different kinds of tests, please see Code Testing chapter in The Turing Way.
Literate Programming
Literate programming is about comments and documentation and telling other humans what is happening in your pipeline. Depending on the scale of your computational projects, you may use one or multiple of these options:
- Inline comments when writing code (directly written in the script file)
- A README file describing what your code does
- An online documentation as a user and developer guide with step-by-step explanation
- RMarkdown or Jupyter Notebook with examples
Most of these files can be written in Markdown. Markdown is a way of writing plain text in any simple text editor that doesn’t need specific (proprietary) software to read it (no need for Microsoft Word), which can be converted to many formats including HTML, PDF or even Word documents. Many online tools including GitHub support Markdown files (.md files).
Marking up your text and code is quite simple:
**bold**–> bold_italics_–> italics- “
code snippet” –>code snippet [LINK](https://carpentries-incubator.github.io/managing-computational-projects/)–> LINK
You can do much more:
# Title(first level header)## Heading(second level header)### Subheading(third level header)(insert via a link)
See more in the MarkDown cheatsheet.
MarkDown files are however static, meaning that you can only read the files, but not execute code. R Markdown and Jupyter Notebook provide an interactive environment to work and share your code with documentation and examples for your project. For practice details about R Markdown, please see The Definitive Guide and for Jupyter Notebook, please see Jupyter/IPython Notebook Quick Start Guide.
These options are useful for communicating about the analysis workflow and results at any stage with other collaborators or the wider research community when developing open source code. Please note that sharing code in any format would require your collaborators to run and test your code locally. There are easier options to allow to run code in the browser using Binder, which we will discuss in the last lesson.
Reproducible Research Environment
Researchers’ working environments evolve as they update software, install new software, and move to different computers. If the project environment is not captured and the researchers need to return to their project after months or years (as is common in research), they will be unable to do so confidently. a computational environment is a system where a program is run. This includes features of hardware (such as the numbers of cores in any CPUs) and features of the software (such as the operating system, programming languages, supporting packages, other pieces of installed software, along with their versions and configurations).
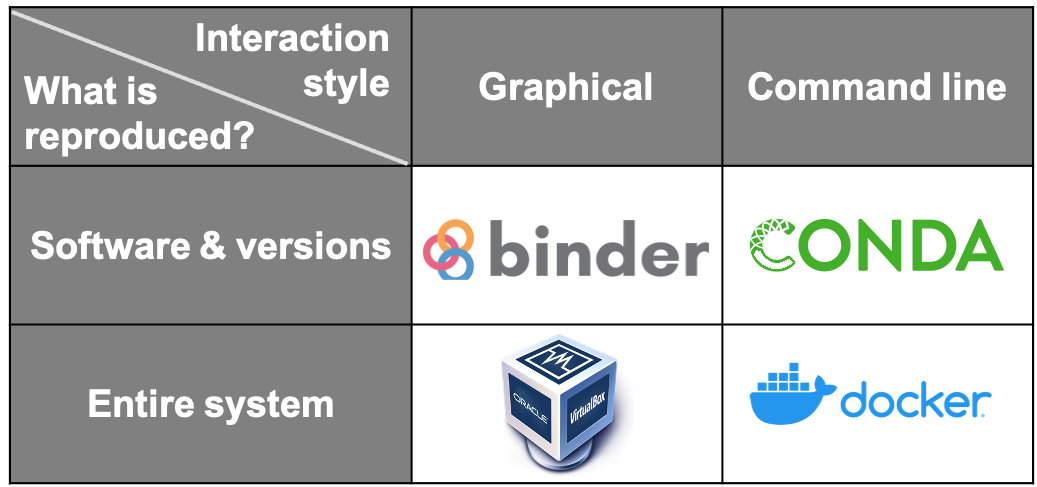
There are several ways of capturing computational environments. The major ones covered in this chapter will be Package Management Systems, Binder, Virtual Machines, and Containers. Each has its pros and cons, and the most appropriate option for you will depend on the nature of your project. They can be broadly split into two categories: those that capture only the software and its versions used in an environment (Package Management Systems), and those that replicate an entire computational environment - including the operating system and customised settings (Virtual Machines and Containers).
Another way these can be split is by how the reproduced research is presented to the reproducer. Using Binder or a Virtual Machine creates a much more graphical, GUI-type result. In contrast, the outputs of Containers and Package Management Systems are more easily interacted with via the command line. Please read more about each of these concepts and their practice use, please visit Capturing Computational Environments in The Turing Way.
Continuous integration
Continuous Integration (CI) is the practice of integrating changes to a project made by individuals into a main, shared version frequently (usually multiple times per day). CI is also typically used to identify any conflicts and bugs that are introduced by changes, so they are found and fixed early, minimising the effort required to do so. Running tests regularly also saves humans from needing to do it manually. By making users aware of bugs as early as possible researchers (if the project is a research project) do not waste a lot of time doing work that may need to be thrown away, which may be the case if tests are run infrequently and results are produced using faulty code. There are many CI service providers, such as GitHub Actions that come with their own advantages and disadvantages.
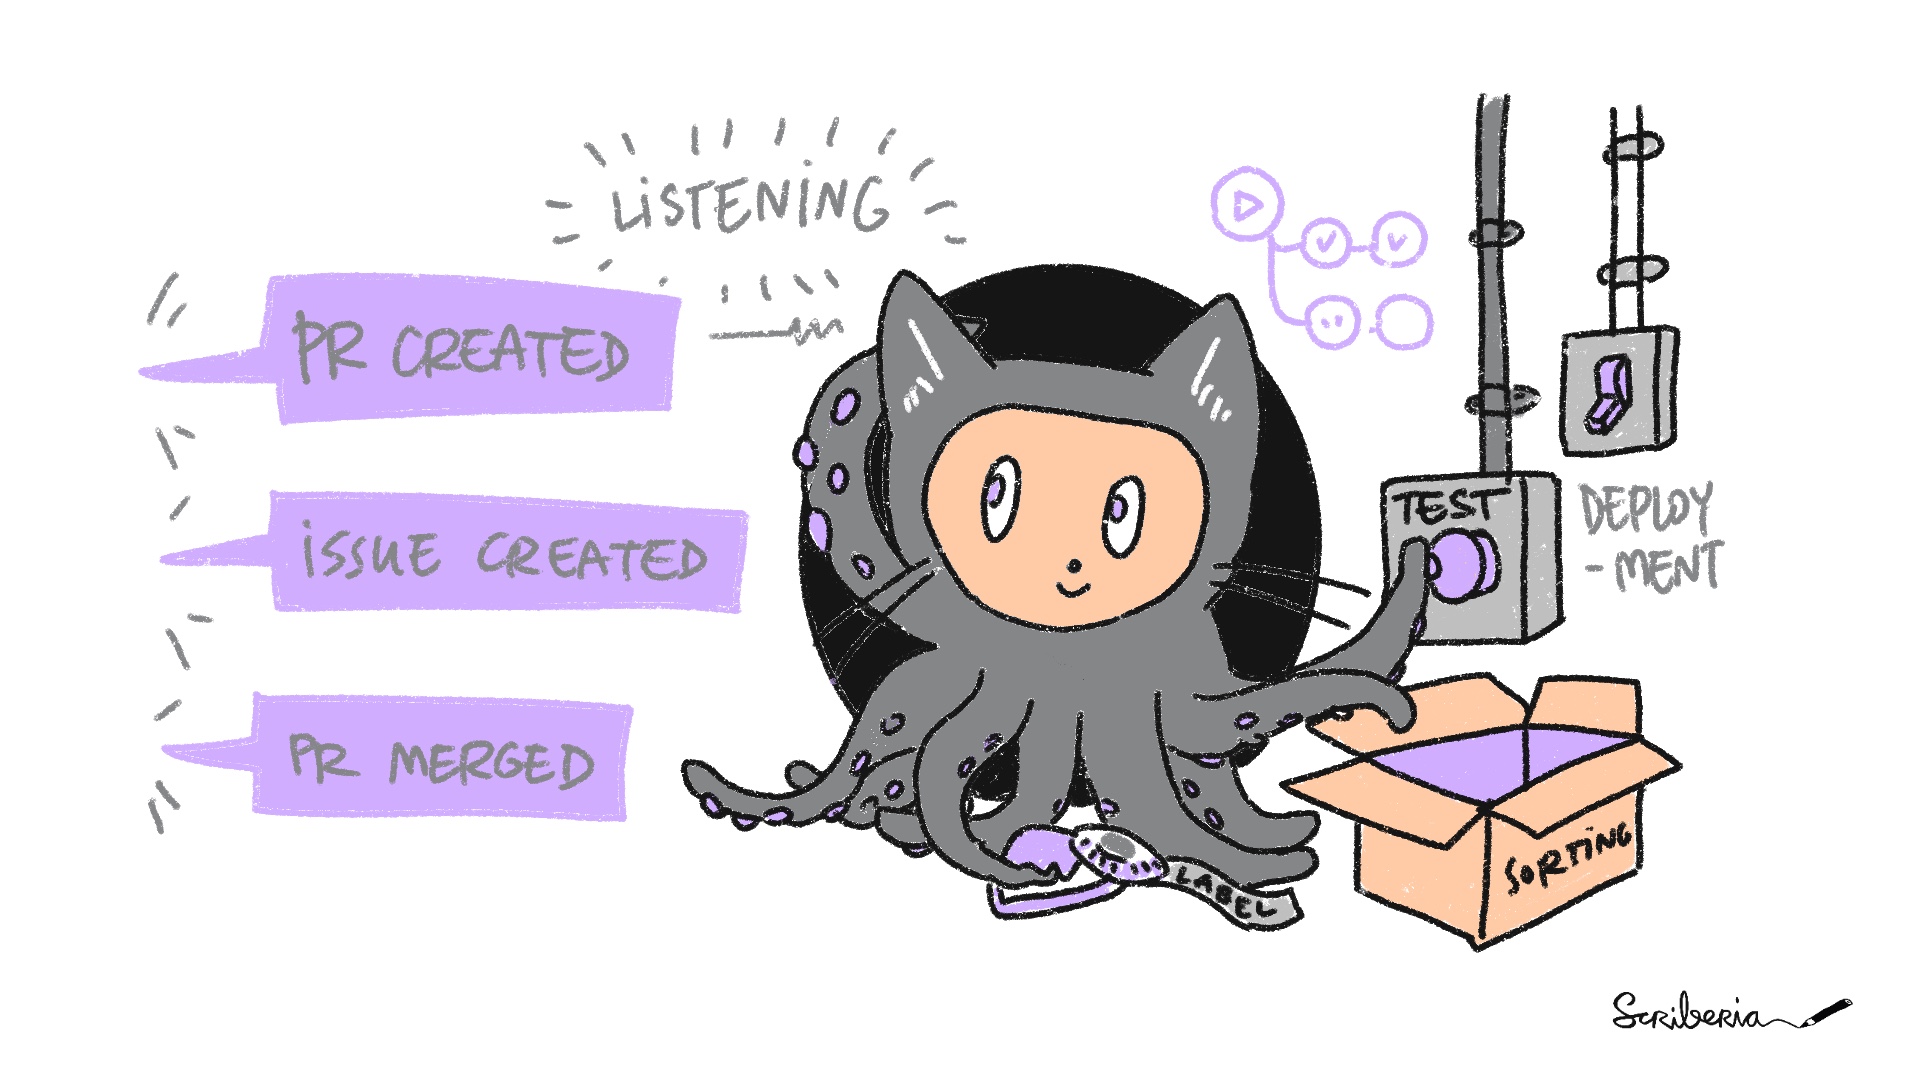 The Turing Way project illustration by Scriberia. Used under a CC-BY 4.0 licence. DOI: 10.5281/zenodo.3332807.
To learn more about different CI tools and how to use them, please read the Continuous Integration chapter in The Turing Way.
References
- The Turing Way Community. (2021). The Turing Way: A handbook for reproducible, ethical and collaborative research (1.0.1). Zenodo. https://doi.org/10.5281/zenodo.5671094. This episode reuses contents from the following The Turing Way chapters:
- Continuous Integration
- Code Testing
- Code Quality chapter in The Turing Way.
- Capturing Computational Environments
- The Definitive Guide
- Jupyter/IPython Notebook Quick Start Guide
- Guides to Better Science by British Ecological Society.
Key Points
Make group leaders familiar with practices that are crucial for their teams to develop reproducible code.
Encourage researchers to think about code reproducibility through quality check, testing, sharing their code as well as a research environment.
Introduce Continuous Integration for automating the testing process.
Code Review
Overview
Teaching: 10 min
Exercises: 0 minQuestions
What are the main objectives and best practices for reviewing code?
What are the difference between synchronous and asynchronous code reviews?
How can group leaders facilitate a collaborative environment for code review?
Objectives
Explain different processes and best practices for code review.
Discuss tips, tricks and benefits of code review.
Share some ways to involve all group members in code review.
Code Review
The most difficult part of writing code is always to make it understandable to other people, including yourself a few months down the track. There’s certainly no shame in finding out that your code wasn’t as easy to understand or use as you’d hoped, so don’t take it personally when it happens (which it always does, at least in my experience), but treat it as an opportunity to improve.
Fernando Perez, Code reviews: the lab meeting for code
A simple objective of the review process is to catch bugs and elementary errors that might have been missed during the development phase. Code review can also help improve the overall quality while ensuring that code is readable and easy to understand. As a group leader, you can also make sure code is functional and literate as early as possible, and encourage your students to avoid messy “good enough” code that causes chaos later.
Code review is often done in pairs, with each reviewer also having some of their code reviewed by their partner. Doing this can help programmers to see and discuss issues and alternative approaches to tasks, and to learn new tips and tricks.

The Turing Way project illustration by Scriberia. Used under a CC-BY 4.0 licence. DOI: 10.5281/zenodo.3332807.
There are different methods for code review.
Synchronous - Pair Programming
Helping the student go through their scripts, catch errors and debug side by side
- The PI sits down with her PhD student who has been writing a function for cleaning bioinformatics data.
- The PI knows Python well and takes the opportunity to discuss code while helping their student organise the code better.
- The student shows the PI some odd errors and so they run some tests with expected outcomes to find what the problem is and solve it.
- The PhD student learns and applies to test practices to help make code robust.
The problem with synchronous coding sessions is making time for it and whether or not the supervisor has experience with the specific language.
Synchronous - Group Code Tour or Informal Walkthroughs
Narrating code and software steps
The researcher may present their pipeline to describe the logical steps using documentation, pseudocode, or describing how to run the code.
- A postdoc has been working on some analysis that provides statistics results that he hopes to publish soon. During a lab meeting, the postdoc presents the steps of the analysis code as logical steps.
- The lines of code are shown for those in the meeting that know R, but the postdoc explains the steps verbally as well for those who don’t understand R.
- The group discuss and provides comments on the choices and order of the analysis pipeline, a PhD student notices a jump in logic that wasn’t picked up previously, and an advanced R user in the lab makes suggestions about making some parts run faster.
These sessions do not rely on everyone knowing the language, and it is the responsibility of the coder to present their work clearly and logically for everyone to follow. Group discussions can be very informative for everyone involved and put the analysis under scrutiny.
Suggestions for the meeting leader
- Keep it a safe environment, i.e. make sure chastising is relatively gentle even when deserved (but do point out when code doesn’t meet the required standard – frame it as a learning experience though).
- Make sure there’s a core of vocal participants so it isn’t always you.
- Make it clear when you’re presenting yourself that your code isn’t perfect, point out some of those imperfections yourself if the audience is slow to do so, and do present yourself.
- Patiently explain when things are not wrong but just stylistic differences (but make it clear that some styles are bad, often helpful e.g. asking people to guess what a function returns from its name).
Shared by Rob Knight with Fernando Perez in the post Code reviews: the lab meeting for code
Asynchronous - I’ll get back to you on that
Making sure everyone is free at the same time for a lab meeting can be challenging. Hence, asynchronous code review practices are more suitable for busy supervisors or collaborators in different time zones.
The asynchronous review process allows others to run the code themselves using a reproducible environment, or simply reads through the scripts and share their feedback asynchronously.
Consider a scenario:
A postdoc has created a model in Python and creates a Binder with all the dependencies necessary. She sends the file to her supervisor who can run the code within her browser, no installation is required. The supervisor can then run the code herself to review it and check the individual parts over the next week. The supervisor adds a commented version of the script to the postdoc’s repo with a merge request.
Reviewing code in small chunks incrementally as the project is developing can help make the code review process a lot more efficient. Asynchronous feedback removes the time pressure but can be easily forgotten!
Reviewing more than 400 lines of code (LoC) can have an adverse impact on your ability to find bugs, and in fact, most are found in the first 200 lines. - Recommendation from Code Review at Cisco Systems
5 code review best practices. Work Life by Atlassian, Usman Ghani
Multiple people can also review the code asynchronously.
Turing Way: Recommendations for Code Reviewing
Unlike traditional, “academic-style” peer review, most code review systems have several advantages: they’re rarely anonymous, they’re public-facing, and without the broker of an editor, contact between reviewer and reviewee can be direct and rapid. This means code review is typically a fast, flexible, and interactive process.
Github features to help with code review (Click to see)
Commit changes: uploading snapshots when the code changes. The history of all changes are therefore saved and can be reverted.
Branching: keep a version of the code separate while making experimental changes or keeping track of collaborative work. Can try out new functionality or edit in parallel without impacting the code base.
Pull Request: Bring the changes made on a branch over to the main code base. Can be used to request a code review (see Reviewers on the right panel)
Review: A pull request can be reviewed and commented on.
Author: Lydia France (Junior Data Scientist, The Alan Turing Institute, UK)
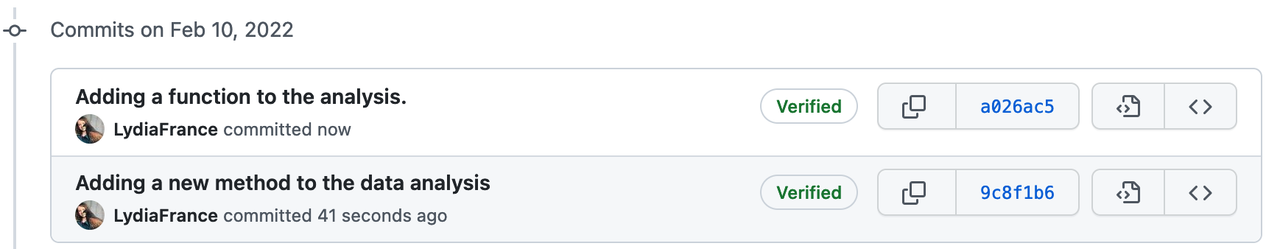
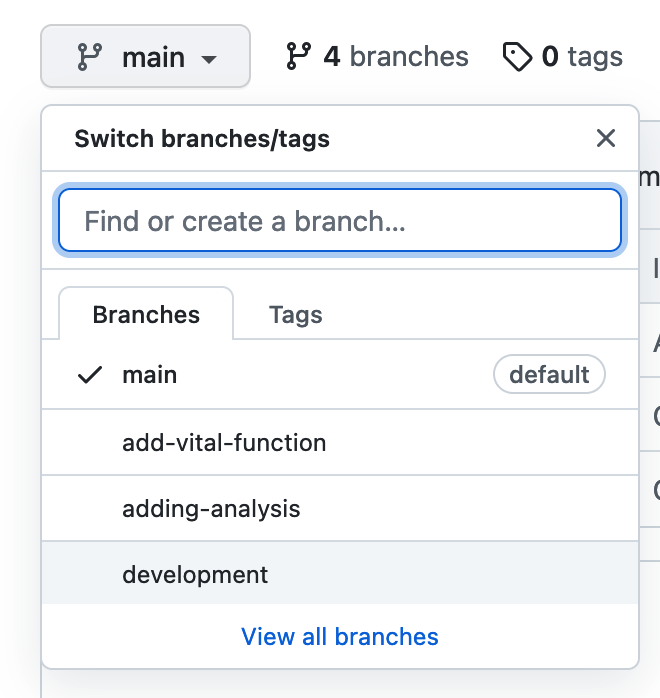
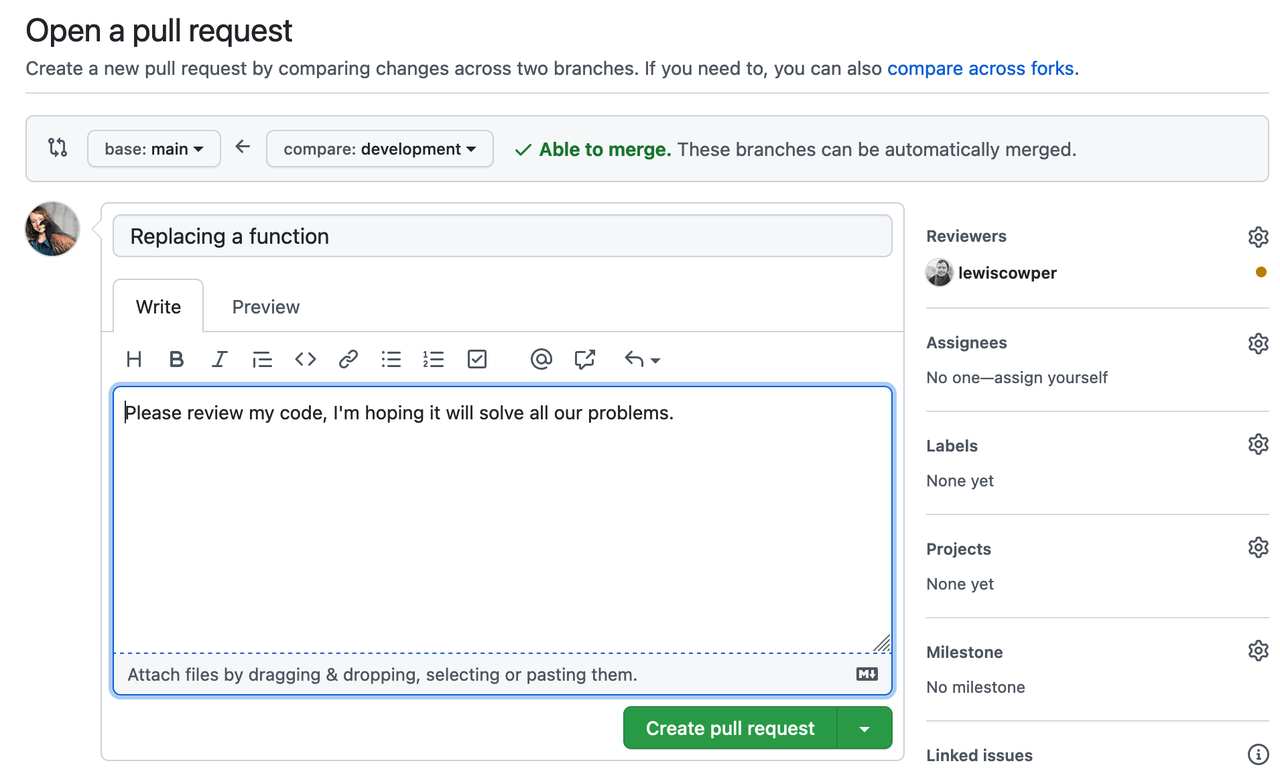
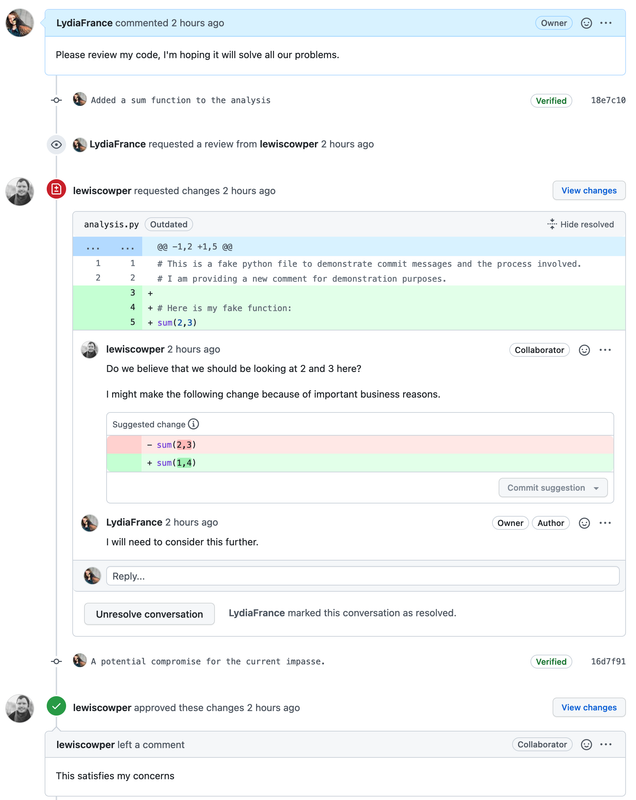
Reviewing is not about creating more work, nor the PI rewriting everything
Instead, it is just another part of peer review and accountability within the scientific process. It is also an opportunity for everyone to learn better practices from each other, and solve issues that have plagued one person for weeks!
Scientists are very aware that their understanding of code dissipates over time and that this is a large hidden cost. Equally, they suspect that they spend a lot of time reinventing wheels. They may not know how code review will help with that, but they hope that it will.
One of the mentors expected scientists to overhaul complete code bases. The advice from one mentor was cogent: if you check the docstring and write a test every time you touch a method, the code improvements will accumulate over time with minimal effort.
Someone who isn’t intimately involved with your project should understand from the module documentation and the comments what you are trying to do, what approach you’re taking, and why they should expect it to work.
Take some time to prepare a presentation about your code that will answer the above questions even for someone who hasn’t read the code. You’re more likely to get useful feedback, rather than nitpicking about syntax, if the audience can see the big picture.
Keep it a safe environment, i.e. make sure chastising is relatively gentle even when deserved (but do point out when code doesn’t meet the required standard – frame it as a learning experience though).
Marian Petre and Greg Wilson. “Code review for and by scientists: preliminary findings.” (2014).
For further considerations in code review, please read Code Reviewing Process chapter in The Turing Way.
What to look for during Code Review
Reviewing code makes a big difference. Knowledge of the language is not always necessary!
These are very common, everyone does this.
Bugs/Potential bugs
- Repetitive code
- Code saying one thing, documentation saying another
- Off-by-one errors
- Making sure each function does one thing only
- Lack of tests and sanity checks for what different parts are doing
- Magic numbers (a number hardcoded in the script)
Unclear, messy code
- Bad variable/method names
- Inconsistent indentation
- The order of the different steps
- Too much on one line
- Lack of comments and signposting
Fragile and non-reusable code
- Tailor-made and manual steps
- Only works with the given data
Modified from *What to look for when code reviewing*
Benefits of Code Review
In a group of 11 programs developed by the same group of people, the first 5 were developed without reviews. The remaining 6 were developed with reviews. After all the programs were released to production, the first 5 had an average of 4.5 errors per 100 lines of code. The 6 that had been inspected had an average of only 0.82 errors per 100. Reviews cut the errors by over 80 percent.
Code Complete by Steve McConnell
The main benefit is finding problems, and finding them early enough that there aren’t frustrating consequences. The penalty for finding a bug once all the figures have been produced and conclusions drawn, or, worst-case scenario, after a publication, is much higher than the penalty for taking the time to review.
Writing code collaboratively also benefit directly your team members:
- Less time redoing work or refactoring
- Increased productivity
- Greater confidence in own work
- Learning better techniques
- Reduced time debugging alone
- Knowledge exchange and group cohesion
For a group leader, the benefits include:
- Better understanding of the projects
- More maintainable and better-documented code that is easy to understand and modify
- Better insight into any problems with data
- Earlier visibility of quality issues
- Group reviews reduce the work burden
- More robust analysis pipelines that can be reused and modified
- High-quality code that can be released
Important things to bear in mind:
Code reviews should not be used to evaluate individuals and their skill levels. An open and safe environment where revealing mistakes and errors should not come with penalties or shame. Code reviews should also be done early and often, to normalise this practice in the research team.
In their book Peer Reviews in Software: A Practical Guide, Karl E. Wiegers says:
The temptation to perfect the product before you allow another pair of eyes to see it. This is an ego-protecting strategy: you won’t feel embarrassed about your mistakes if no one else sees them. …review [is not] a seal of approval but rather in-process quality-improvement activity. Such reluctance has several unfortunate consequences. If your work isn’t reviewed until you think it’s complete, you are psychologically resistant to suggestions for changes.
If the program runs, how bad can it be? You are likely to rationalise away possible bugs because you believe you’ve finished and you’re eager to move on to the next task. Relying on your own desk checking and unit testing ignores the greater efficiency of a peer review for finding many defects*
Group Code Writing
As well as reviewing specific scripts and analyses written by a single individual, can be very beneficial to solving programming problems as a team. Setting aside an afternoon to work as a group will help teach less experienced members of the group and more efficiently solve very difficult problems.
Groups of people working on a specific problem are often known as “Hackathons” in programming. These can last multiple days (hopefully with downtime!). With very large groups, people can work in pairs or small groups with delegated parts of the problem to solve and regularly meet back together to discuss and evaluate. If there is a complex solution in computational methods that most people in the group need, it makes sense to find it together.
Similarly, documentation sprints are useful to dedicate time to regularly bring a codebase to a good minimum standard. Splitting the task across the team as an event, creating documentation and working examples for code repos and releasing it can help others use your computational methods and tools to increase the impact of your work. Having regularly updated documentation also reduces onboarding time for new members picking up the shared methods in the lab.
Group work shares the burden and allows knowledge exchange and support within the team.
References
- The Turing Way Community. (2021). The Turing Way: A handbook for reproducible, ethical and collaborative research (1.0.1). Zenodo. https://doi.org/10.5281/zenodo.5671094. Code Reviewing Process Chapter.
- Fernando Perez, Code reviews: the lab meeting for code
Key Points
There are many benefits of code review and this should be implemented and practised in research team culture as early and as frequently as possible.
Synchronous code review creates opportunities for researchers to get feedback and learn from others in real-time.
Asynchronous code review is a good practice when working with busy researchers or collaborators in different time zones.
Publication and release
Overview
Teaching: 10 min
Exercises: 0 minQuestions
Why should I make my research objects available?
What open source tools to use for applying data science practices in bioscience?
How to get your research work cited and invite more contributions to your project?
Objectives
First learning objective. (FIXME)
Publications

While the output of research projects is usually centred around publishing a journal article, this format of science communication and knowledge sharing is increasingly restrictive with the new ways scientific research is conducted. The requirements from journals themselves is also expanding, you are now often asked to upload data sets and code as part of your publication. Releasing data is increasingly a requirement from funding bodies, and outputs from research groups can go beyond a single paper, releasing tools and methods that can be used worldwide.
In general there are different degrees of openness.
- Fully private data and code, unavailable
- Pseudo-open – “available on request”
- Released static code parallel to a research paper, see Zenodo or Figshare
- Open online repository – CRAN, GitHub
- Collaborative, open science tool with ongoing development
What can be released:
- Open Data: Documenting and sharing research data openly for re-use.
- Open Source Software: Documenting research code and routines, and making them freely accessible and available.
- Open Hardware: Documenting designs, materials, and other relevant information related to hardware, and making them freely accessible and available.
- Open Access: Making all published outputs freely accessible for maximum use and impact.
- Open Notebooks: An emerging practice, documenting and sharing the experimental process of trial and error.
https://the-turing-way.netlify.app/reproducible-research/open.html
Open or Private?
Researchers often worry that they need to hide their code to prevent others stealing it.
“After giving talks about open science I’ve sometimes been approached by skeptics who say, ‘Why would I help out my competitors by sharing ideas and data on these new websites? Isn’t that just inviting other people to steal my data, or to scoop me? Only someone naive could think this will ever be widespread.’ As things currently stand, there’s a lot of truth to this point of view. But it’s also important to understand its limits. What these skeptics forget is that they already freely share their ideas and discoveries, whenever they publish papers describing their own scientific work. They’re so stuck inside the citation-measurement-reward system for papers that they view it as a natural law, and forget that it’s socially constructed. It’s an agreement. And because it’s a social agreement, that agreement can be changed. All that’s needed for open science to succeed is for the sharing of scientific knowledge in new media to carry the same kind of cachet that papers do today”
Nielsen, M. Reinventing Discovery: The New Era of Networked Science. Princeton University Press, 2011.
https://journals.plos.org/plosbiology/article?id=10.1371/journal.pbio.3000246
Code release
For computational projects, releasing your work in an open repository has parallels with publications.

There can be specific requirements to keep code bases and/or data private. See the section below for good and not so good reasons for keeping work private.
You can release code and data associated with a research article as a series of files/folders. If your project follows the folder template introduced in a previous episode, for example:

Examples of a template folder tree for a computational project. https://github.com/tonic-team/Tonic-Research-Project-Template
You could bundle folders into a .zip file and upload it to Zenodo.
Zenodo

Zenodo is a general-purpose open-access repository developed under the European OpenAIRE program and operated by CERN. It allows researchers to deposit research papers, data sets, research software, reports, and any other research related digital artefacts.
Uploads to Zenodo are:
- Safe — your research is stored safely for the future in CERN’s Data Centre for as long as CERN exists.
- Trusted — built and operated by CERN and OpenAIRE to ensure that everyone can join in Open Science.
- Citeable — every upload is assigned a Digital Object Identifier (DOI), to make them citable and trackable. No waiting time — Uploads are made available online as soon as you hit publish, and your DOI is registered within seconds.
- Open or closed — Share e.g. anonymized clinical trial data with only medical professionals via our restricted access mode.
- Versioning — Easily update your dataset with our versioning feature.
- GitHub integration — Easily preserve your GitHub repository in Zenodo.
- Usage statistics — All uploads display standards compliant usage statistics
Citable Code
The Citation File Format provides citation metadata, for software or datasets, in plaintext files that are easy to read by both humans and machines.
Adding a CITATION.cff file to your folder means it can be cited when others use it, increasing recognition for your work and your research project’s impact.
See more at The Turing Way: CITATION.cff
https://the-turing-way.netlify.app/_images/software-credit.jpg
Collaborative Open Code

Downloading code and data files from Zenodo or other open access repositories can be useful when someone wants to review your the final outcome of your computational work. However, with an open GitHub repository, sharing code becomes much more collaborative and in real-time.
![]()
Uploading code in progress to an open GitHub Repo is the best and most well-used method for programming collaboration.
As you develop a tool or methodology, users have the ability to use your code while it is a work in progress and others can contribute or add features.

When using specifically R, you could release R packages on CRAN where anyone can then download and use you code.
Open Science Tools – Research Software with Impact
Many research groups produce widely used tools and software that are used across biomedical and life sciences. Examples of an open science tool in ongoing development and collaboration:
DeepLabCut
https://github.com/DeepLabCut/DeepLabCut
A toolbox for markerless pose estimation of animals performing various tasks.
Cellpose
https://github.com/MouseLand/cellpose
https://cellpose.readthedocs.io/en/latest/
A generalist algorithm for cell and nucleus segmentation.

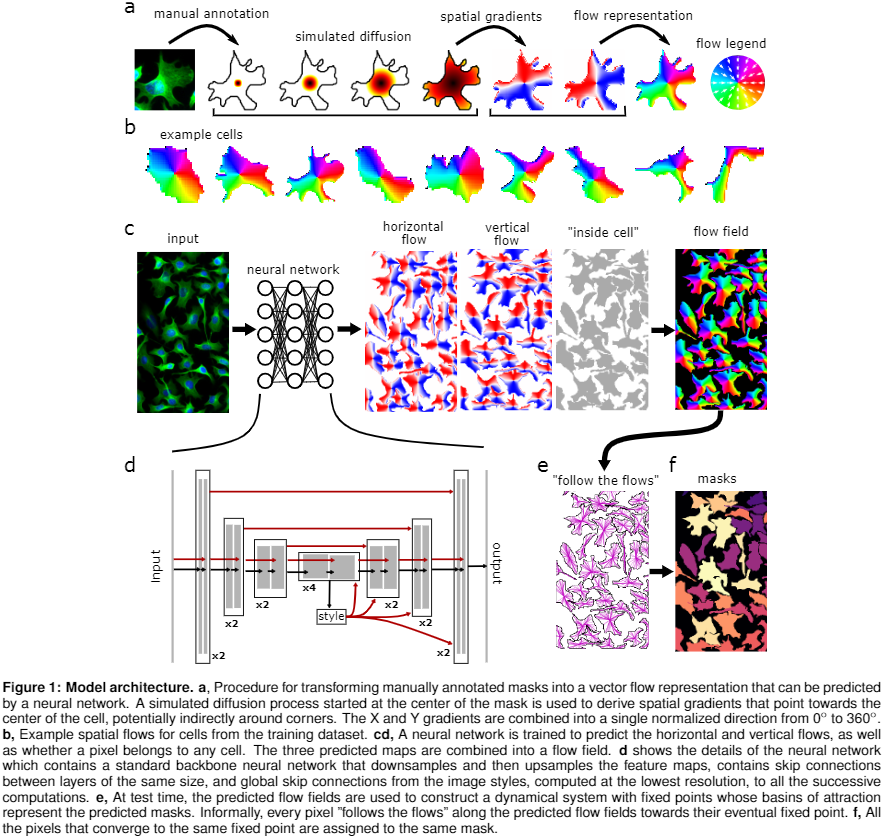
Qupath
https://github.com/qupath/qupath
Extensive tools to annotate and view images, including whole slide & microscopy images. Interactive machine learning for both object & pixel classification.
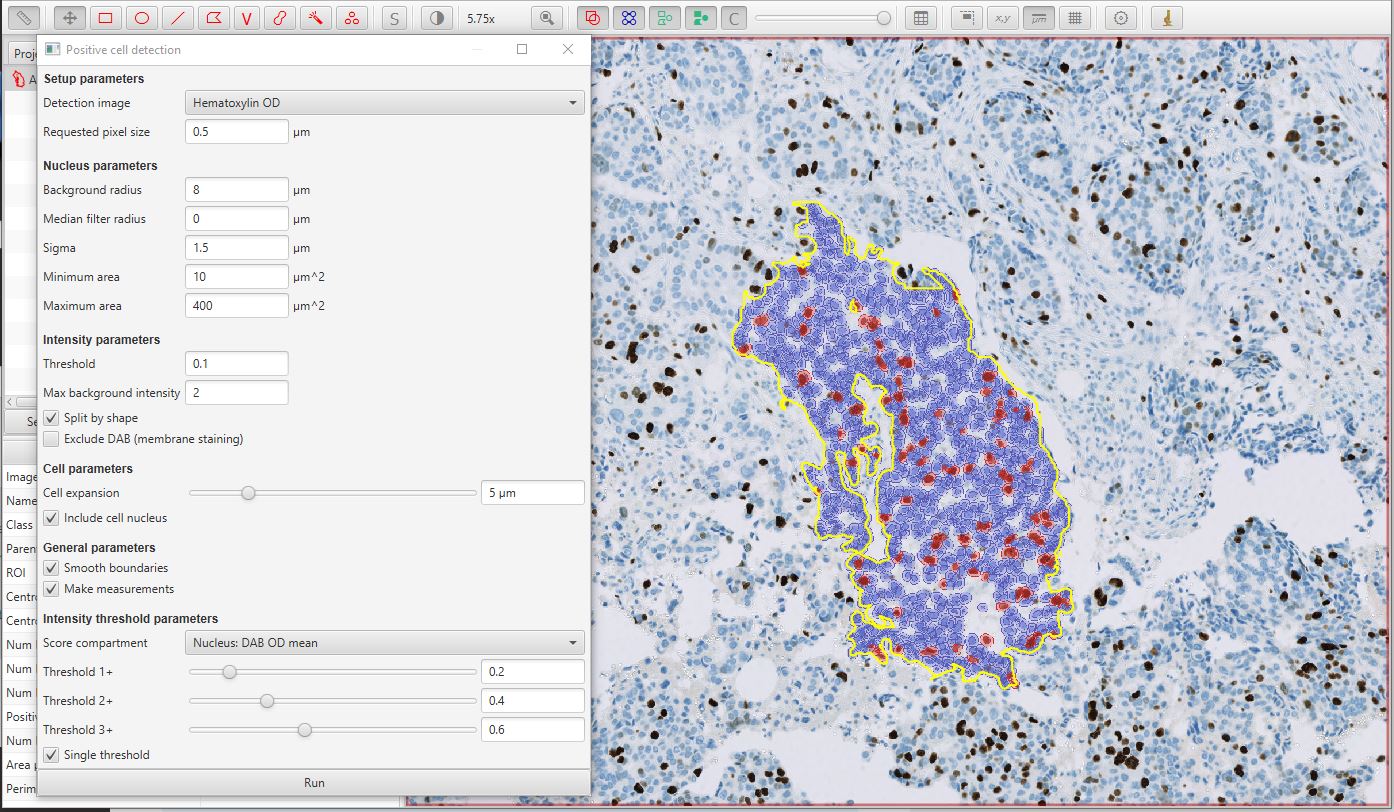
Key Points
First key point. Brief Answer to questions. (FIXME)